Book 01 — Azure Networking Deep Dive
Monitoring, Troubleshooting, and Cost
Effective network operations require two things: reactive diagnosis tools to resolve incidents quickly, and proactive monitoring to catch degradation before users notice. Azure provides Network Watcher for diagnostics, NSG flow logs and Traffic Analytics for visibility, and Azure Monitor for alerting on network health metrics.
Azure Network Watcher
Network Watcher is a regional service that must be enabled per subscription per region. It provides both one-shot diagnostic tools and continuous monitoring capabilities.
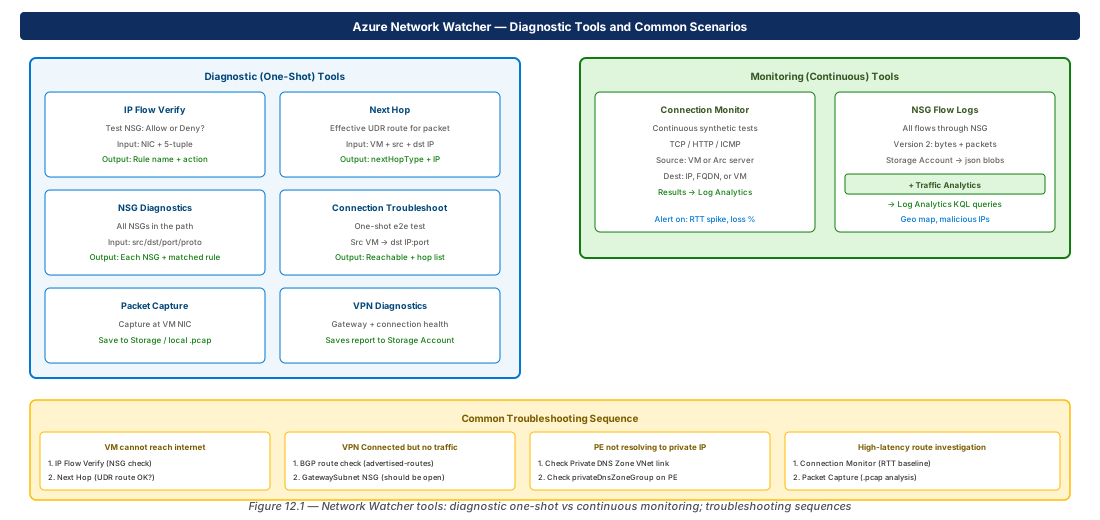
IP Flow Verify
Tests whether an NSG would allow or deny a specific 5-tuple flow at a given VM NIC. Returns the matching rule name.
# Does NSG allow TCP 443 inbound to this VM?
az network watcher test-ip-flow \
  --resource-group rg-app --vm vm-web-01 \
  --direction Inbound \
  --local 10.0.1.4:443 \
  --remote 0.0.0.0:60000 \
  --protocol TCP
Next Hop
Shows the effective route (next hop type and IP) for a packet leaving a VM, respecting all UDRs, BGP-learned routes, and system routes.
# What is the next hop for traffic from vm-web-01 to 8.8.8.8?
az network watcher show-next-hop \
  --resource-group rg-app --vm vm-web-01 \
  --source-ip 10.0.1.4 \
  --dest-ip 8.8.8.8
# nextHopType: VirtualAppliance → UDR forcing through Firewall
NSG Flow Logs and Traffic Analytics
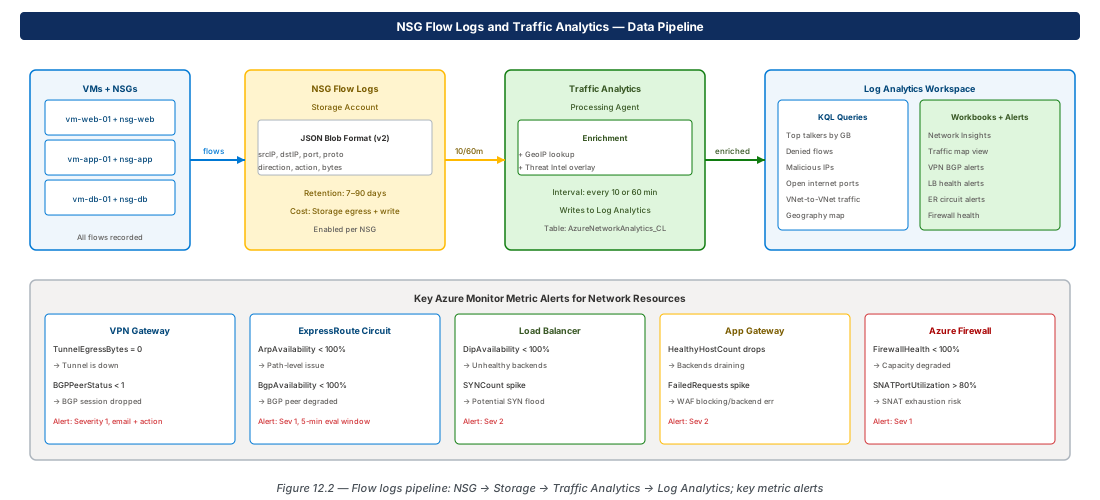
NSG flow logs v2 record every flow through an NSG — allowed and denied — as JSON blobs in a Storage Account with byte and packet counts. Traffic Analytics processes these logs and writes enriched records to Log Analytics, enabling KQL-based analysis.
# Enable NSG flow logs v2 with Traffic Analytics
az network watcher flow-log create \
  --name fl-nsg-app --resource-group rg-app \
  --location eastus2 --nsg nsg-app \
  --storage-account sa-flowlogs \
  --enabled true --format JSON \
  --log-version 2 --retention 7 \
  --workspace ".../law-monitoring" \
  --traffic-analytics true \
  --interval 10
Traffic Analytics KQL Queries
// Top 10 talkers by bytes
AzureNetworkAnalytics_CL
| where SubType_s == "FlowLog"
| summarize TotalBytes = sum(BytesSent_d + BytesReceived_d) by SrcIP_s
| top 10 by TotalBytes

// Denied flows — investigate blocked traffic
AzureNetworkAnalytics_CL
| where FlowStatus_s == "D"
| project TimeGenerated, SrcIP_s, DestIP_s, DestPort_d, NSGRule_s
Azure Monitor Network Insights
Azure Monitor → Networks provides a unified topology view across all network resources. Key metrics to alert on:
| Resource | Metric | Alert Condition |
|---|---|---|
| VPN Gateway | TunnelEgressBytes | = 0 for 5 min → tunnel down |
| VPN Gateway | BGPPeerStatus | < 1 → BGP session down |
| ExpressRoute | ArpAvailability | < 100% → path-level issue |
| Load Balancer | DipAvailability | < 100% → unhealthy backends |
| App Gateway | HealthyHostCount | Drop → backend draining |
| Azure Firewall | FirewallHealth | < 100% → degraded |
| Azure Firewall | SNATPortUtilization | > 80% → SNAT exhaustion risk |
Network Cost Patterns
| Cost Driver | Rate (approx) | Mitigation |
|---|---|---|
| VNet Peering intra-region | $0.01/GB per direction | Use vWAN or consolidate spoke-to-spoke flows |
| VNet Peering cross-region | $0.02–$0.05/GB | Consider regional hubs |
| VPN Gateway egress | Per-SKU + data | Use ER Unlimited for high-volume workloads |
| Public IP outbound (internet) | Per-GB tiered | NAT Gateway pools SNAT — avoids per-VM PIP |
| Azure Firewall | Per-hour + per-GB | Centralise in hub; avoid multiple FW per spoke |
Tip
In hub-and-spoke topologies, spoke-to-spoke flows traverse two peering links and are charged twice. For workloads with high east-west traffic between spokes, consider co-locating them in the same VNet or evaluating Azure Virtual WAN, which charges a flat hub processing fee rather than double peering.
Common Troubleshooting Scenarios
VM Cannot Reach the Internet
- Run
az network watcher test-ip-flow— confirm NSG is not denying outbound - Run
az network watcher show-next-hop— confirm next hop isInternet(orVirtualApplianceif routed through Firewall) - If through Firewall: check Application/Network rule allows the destination FQDN/IP
VPN Tunnel Connected But No Traffic Passes
- Verify BGP route exchange:
az network vnet-gateway list-advertised-routes - Confirm on-premises side is advertising the correct prefixes
- Check GatewaySubnet — no restrictive NSG should exist on it
- IP Flow Verify from a VM in the connected subnet
Private Endpoint Not Resolving to Private IP
- Check Private DNS Zone is linked to the VM's VNet
- Check
privateDnsZoneGroupis configured on the Private Endpoint - Verify A record exists:
az network private-dns record-set a list --zone-name privatelink.blob.core.windows.net - Run
nslookupfrom the VM — should see CNAME to privatelink zone, then private IP
Lab: NSG Flow Logs Setup
Enable NSG Flow Logs (CE-25)
RG="rg-lab-ch12"; LOC="eastus2"
az group create --name "$RG" --location "$LOC"

SA_NAME="salabflowlogs$RANDOM"
az storage account create \
  --name "$SA_NAME" --resource-group "$RG" \
  --location "$LOC" --sku Standard_LRS

az network nsg create --name nsg-lab \
  --resource-group "$RG" --location "$LOC"

az network watcher configure \
  --resource-group NetworkWatcherRG \
  --locations "$LOC" --enabled true

# Enable flow log (Traffic Analytics requires Log Analytics workspace)
az network watcher flow-log create \
  --name fl-nsg-lab --resource-group "$RG" \
  --location "$LOC" --nsg nsg-lab \
  --storage-account "$SA_NAME" \
  --enabled true --log-version 2 --retention 7

az group delete --name "$RG" --yes --no-wait
Summary
| Concept | Key Fact |
|---|---|
| IP Flow Verify | Tests NSG allow/deny for a 5-tuple; returns matched rule name |
| Next Hop | Shows effective UDR next hop for a packet from a VM NIC |
| Connection Monitor | Continuous synthetic tests; alerts on RTT / packet loss |
| NSG Flow Logs v2 | All flows; byte + packet counts; JSON to Storage Account |
| Traffic Analytics | Enriches flow logs; top talkers, geo map, malicious IPs in Log Analytics |
| VNet Flow Logs | VNet-scope visibility incl. same-subnet; no NSG required |
| BGPPeerStatus = 0 | VPN/ER BGP session down — alert Severity 1 |
| Peering cost | $0.01/GB intra-region, charged per direction; spoke-to-spoke = 2x |
| Troubleshoot order | IP Flow Verify → Next Hop → NSG Diagnostics → Packet Capture |
Chapter: 12 of 12 | Status: v0.1 Draft |