Azure for .NET Developers: Production-Grade Cloud Architecture and Operations
Production Operations, Observability, and Cost Governance
Shipping a .NET application to Azure marks the beginning of an operational journey. Production environments demand structured visibility into system behavior, disciplined resilience testing, and financial accountability mechanisms that prevent cloud sprawl from eroding architectural value. This chapter operationalizes everything built in the preceding eleven chapters — connecting OpenTelemetry to Azure Monitor, designing meaningful SLOs, stress-testing with Azure Chaos Studio, and wiring cost governance into the architectural decision loop.
Observability Architecture: Signals, Pipelines, and Backends
Observability differs from monitoring in a fundamental way: monitoring asks "is the system up?" while observability asks "why is the system behaving this way?" The distinction is critical for distributed .NET workloads spanning App Service, AKS, Azure Functions, and Container Apps, where a single transaction may traverse six services and two message buses. All three correlated signal types — metrics, logs, and traces — are required to navigate that complexity.
The modern observability stack pairs OpenTelemetry (CNCF-graduated standard for instrumentation and propagation) with Azure Monitor (ingestion, indexing, and querying via Application Insights, Log Analytics Workspaces, and Azure Managed Grafana). OpenTelemetry owns instrumentation; Azure Monitor owns storage and analysis. Because OpenTelemetry's exporter model is backend-agnostic, you can route the same signal stream to Prometheus or Jaeger without changing application code.
Signal Taxonomy and Collection Architecture
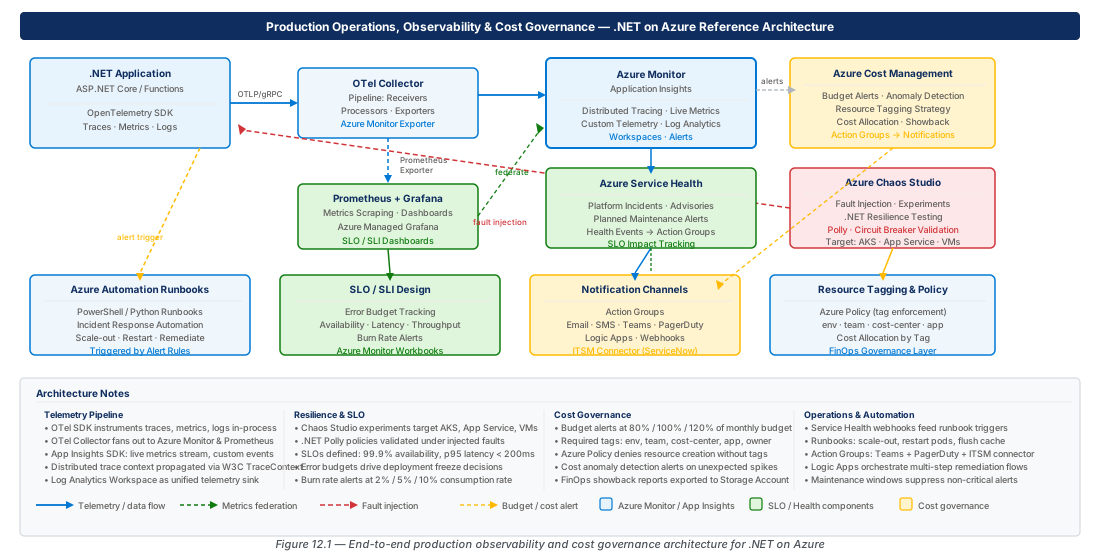
Metrics are numeric aggregations (request rate, latency percentiles, memory pressure) — cheap to store but only answering quantitative questions. Logs are timestamped structured records of discrete events. Distributed traces reconstruct the causal chain of a single request across services. The collection pipeline flows from the application's OTel SDK through the Azure Monitor OpenTelemetry Distro to Application Insights; infrastructure metrics are collected independently by the Azure Monitor Agent; Kubernetes workloads export to Azure Monitor managed Prometheus for PromQL queries in Azure Managed Grafana.
Note
Azure.Monitor.OpenTelemetry.AspNetCore is the recommended integration path for new .NET applications. It replaces Microsoft.ApplicationInsights.AspNetCore for greenfield projects, pre-configures OTLP export to Application Insights, adds Azure-specific resource detectors, and enables W3C TraceContext propagation by default.
OpenTelemetry SDK Configuration for .NET
Three NuGet packages enable the production OTel pipeline: Azure.Monitor.OpenTelemetry.AspNetCore, OpenTelemetry.Instrumentation.AspNetCore, and OpenTelemetry.Instrumentation.Http. The AddPrometheusExporter() call enables dual export — OTLP to Application Insights for traces/logs, Prometheus scrape endpoint for metrics in Azure Managed Grafana.
// Program.cs — OpenTelemetry production configuration
builder.Services.AddOpenTelemetry()
    .UseAzureMonitor(options => {
        options.ConnectionString = builder.Configuration["ApplicationInsights:ConnectionString"];
        options.SamplingRatio = 0.25f; // 25% head-based sampling
    })
    .WithTracing(t => t
        .AddAspNetCoreInstrumentation(o => { o.RecordException = true; })
        .AddHttpClientInstrumentation()
        .AddEntityFrameworkCoreInstrumentation(o => o.SetDbStatementForText = false))
    .WithMetrics(m => m
        .AddAspNetCoreInstrumentation().AddRuntimeInstrumentation()
        .AddPrometheusExporter()) // dual-export: AI + Prometheus scrape
.WithLogging(l => l.AddFilter<OpenTelemetryLoggerProvider>("Microsoft", LogLevel.Warning));Warning
Setting SetDbStatementForText = true records full SQL query text in span attributes — including parameter values — which can capture PII or sensitive filter data in your telemetry backend. Always keep this false in production regulated workloads.
Configuring Azure Monitor and Prometheus Dual Export
Provisioning the observability infrastructure requires a Log Analytics workspace (CapacityReservation SKU above 100 GB/day), a workspace-based Application Insights resource, an Azure Monitor workspace for Prometheus, and Azure Managed Grafana linked as a data source. Use the az grafana data-source create command with MSI authentication to connect Grafana to the Azure Monitor workspace Prometheus endpoint.
Tip
Use the CapacityReservation SKU for Log Analytics workspaces ingesting more than 100 GB/day — it provides a 25–40% discount over pay-as-you-go. Below 100 GB/day, Pay-As-You-Go is more cost-effective. Review your ingestion volume monthly during the first quarter before committing to a tier.
Application Insights Custom Telemetry and Distributed Tracing
Application Insights' real value in production emerges when teams treat telemetry as a first-class engineering concern — instrumenting business events, correlating technical failures with business impact, and designing queries that answer domain-specific operational questions. A generic "request succeeded" signal tells you little; an "OrderPlaced" event with payment method and region dimensions tells you everything.
Custom Events and Business Telemetry
Use ActivitySource for span-level trace events and TelemetryClient.TrackEvent for business analytics custom events with typed properties and measurements. String properties are indexed and filterable in KQL; numeric measurements are aggregatable. Design your split accordingly — put categorical dimensions (region, payment method) in properties, and continuous values (order amount) in measurements.
using var activity = _activitySource.StartActivity("PlaceOrder");
activity?.SetTag("order.customer_id", request.CustomerId);
var order = await _orderRepository.CreateAsync(request);
_telemetryClient.TrackEvent("OrderPlaced",
    new Dictionary<string, string> { ["paymentMethod"] = request.PaymentMethod },
    new Dictionary<string, double> { ["orderValueUsd"] = (double)order.TotalUsd });
activity?.SetStatus(ActivityStatusCode.Ok);Important
Always register your custom ActivitySource name via .AddSource("BookstoreApp.Orders") in the tracing builder. Failing to do so creates spans locally that are never exported — they appear in Activity.Current but will not surface in Application Insights.
Live Metrics and Real-Time Operational Visibility
Application Insights Live Metrics provides one-second-resolution real-time dashboards of request rate, failure rate, response time, and server count, using a persistent push channel that bypasses the 1–5 minute Log Analytics ingestion latency. It is indispensable during rolling deployments: watch Live Metrics while new pods warm up and detect exception rate spikes before they propagate to all instances.
Live Metrics supports runtime custom filters — server-side predicates evaluated on each telemetry item — that can be added and removed without redeployment. During a production incident, you can add a filter to isolate traffic from a specific customer segment or dependency in seconds.
Distributed Tracing and End-to-End Transaction Diagnostics
W3C TraceContext (traceparent header) propagates trace and span IDs across HTTP, gRPC, and Service Bus boundaries. Application Insights reconstructs the complete call graph as an interactive waterfall in the Azure Portal. For Service Bus and Event Hubs, the Azure SDK for .NET automatically serializes trace context into message application properties, creating a Message.Receive span parented to the original publishing span.
Tip
When debugging a distributed trace, use the Failures blade's "End-to-end transaction details" link rather than Transaction Search. The Failures blade pre-filters to traces with recorded exceptions, surfacing the failing span first and saving diagnostic time during incidents.

Service Level Objectives, Service Health Integration, and Runbook Automation
A metric without a threshold is noise. SLOs transform raw telemetry into operational commitments — explicit, measurable statements of the reliability level your system is designed to deliver. Your internal SLO should be more aggressive than any published SLA, providing a safety margin that catches degradation before breaching contractual commitments.
Designing SLOs for .NET Azure Workloads
An SLO has three components: an SLI (the metric measured), a target (the threshold), and a window (rolling evaluation period). The error budget — the allowable failure fraction — should gate engineering decisions: when the error budget is below 20% remaining, freeze high-risk changes until reliability is restored. The following KQL query computes a 28-day rolling availability SLO from Application Insights request telemetry:
let SloWindow = 28d;
requests
| where timestamp > ago(SloWindow)
| summarize
    TotalRequests = count(),
    SuccessfulRequests = countif(success == true),
    FailedRequests = countif(success == false)
| extend
    AvailabilitySLI = round(100.0 * SuccessfulRequests / TotalRequests, 4),
    ErrorBudgetUsedPct = round(100.0 * FailedRequests / (TotalRequests * 0.005), 2)
| project AvailabilitySLI, MeetingSLO = AvailabilitySLI >= 99.5, ErrorBudgetUsedPct
Azure Service Health Integration and Incident Alerting
Azure Service Health provides subscription- and region-scoped platform degradation information that eliminates false positive investigations where teams diagnose application issues that are actually platform degradations. Create separate Activity Log alerts for each event type — service issues (P1 page), planned maintenance (calendar event), and health advisories (team email) — each triggering distinct response workflows via action groups.
# Service Health alert — Active service issues (P1 response)
az monitor activity-log alert create \
  --resource-group "$RG" \
  --name "sha-service-issues-prod-001" \
  --scope "/subscriptions/$(az account show --query id -o tsv)" \
  --condition "category=ServiceHealth" "properties.incidentType=Incident" \
  --action-group "$AG_NAME" \
  --description "Active Azure platform degradation affecting production subscription"
Runbook Automation with Azure Automation and Logic Apps
Every runbook that requires a human to execute a known procedure at 3 AM is a toil debt entry. Azure Automation runs PowerShell/Python scripts in response to alerts or schedules; Logic Apps provide no-code notification and ticketing workflows. A common pattern triggers a Logic App from an alert action group to collect Application Insights error context, format a structured incident message, post to a Teams channel, and create a pre-populated ServiceNow ticket — transforming a bare alert into a self-contained incident kickoff.
Important
Introduce runbook automation incrementally: diagnostic collection first, then human-in-the-loop remediation approval, then fully automated remediation — with at least 90 days of validated production incident outcomes before advancing to each stage. An automated remediation that misdiagnoses root cause can escalate a partial degradation into a complete outage.
| Runbook Pattern | Automation Tool | Human Approval |
|---|---|---|
| Diagnostic data collection | Logic App or Automation Runbook | No |
| Incident channel notification | Logic App | No |
| Ticket creation with context | Logic App | No |
| Service restart (stateless) | Automation Runbook | Yes (approval gate) |
| Scale-out operation | Azure Autoscale | No (pre-approved) |
| Deployment rollback | Azure DevOps Pipeline | Yes |
Azure Cost Management, Budget Alerts, and Resource Tagging
Cloud costs are architecture decisions expressed in dollars. Every SKU choice, replication factor, and retention period has a direct financial consequence. Azure Cost Management is the financial observability layer — the cost equivalent of Application Insights. Without it, engineering teams optimize for performance and reliability while accumulating invisible financial technical debt.
Resource Tagging Strategy for Cost Attribution
Tags are the primary cost attribution mechanism. Without consistent tags, Cost Management can only allocate by subscription and resource group — insufficient for the granular attribution that enables financial accountability. The CAF minimum tag set for production resources includes: environment, workload, cost-center, owner, data-classification, and criticality. Enforce coverage via Azure Policy with Require tag (Deny effect) and Inherit tag from resource group (Modify effect for automatic remediation).
Cost Budgets and Tiered Alerts
Configure tiered budget alerts at 80% actual, 100% actual, and 110% forecast for production workloads. Route alerts to separate action groups for finance and engineering leads. For dev/test, alert earlier (60% actual) to catch runaway spend before it compounds. Review Azure Advisor cost recommendations weekly as engineering backlog items with annualized savings estimates attached.
# Production subscription monthly budget with tiered alerts
az consumption budget create \
  --budget-name "budget-production-operations-monthly-prod-001" \
  --amount 15000 \
  --category Cost \
  --time-grain Monthly \
  --start-date "2026-08-01" \
  --end-date "2027-07-31" \
  --resource-group "$RG_PROD"
# Add --notifications JSON for 80%, 100%, and 110% forecast thresholds
Cost Optimization Decision Framework for .NET Workloads
| Azure Service | Optimization Lever | Typical Reduction | Constraint |
|---|---|---|---|
| App Service | Reserved instances (1-year) | 40% vs. PAYG | Committed capacity |
| AKS | Spot node pools for non-prod | 60–80% node compute | 30s eviction notice |
| Azure SQL | Serverless tier for dev/test | 70–90% dev/test SQL | Cold start on resume |
| Log Analytics | Commitment tier ingestion | 25–35% vs. PAYG | Pre-commit to volume |
| Application Insights | Head-based sampling 10–25% | 75–90% AI ingestion | Reduced trace completeness |
| Azure Storage | Lifecycle management (Cool/Archive) | 60–80% storage cost | Archive rehydration latency |
Warning
A .NET application running at DEBUG log level in production can generate 50–200 GB/day of log data — two orders of magnitude more than the same app at WARNING level. Conduct a log level audit on every production service before committing to any Log Analytics pricing tier. Configure the OTel SDK to emit at WARNING in production, with dynamic per-namespace lowering via Azure App Configuration without redeployment.
Azure Chaos Studio: Resilience Testing and Fault Injection
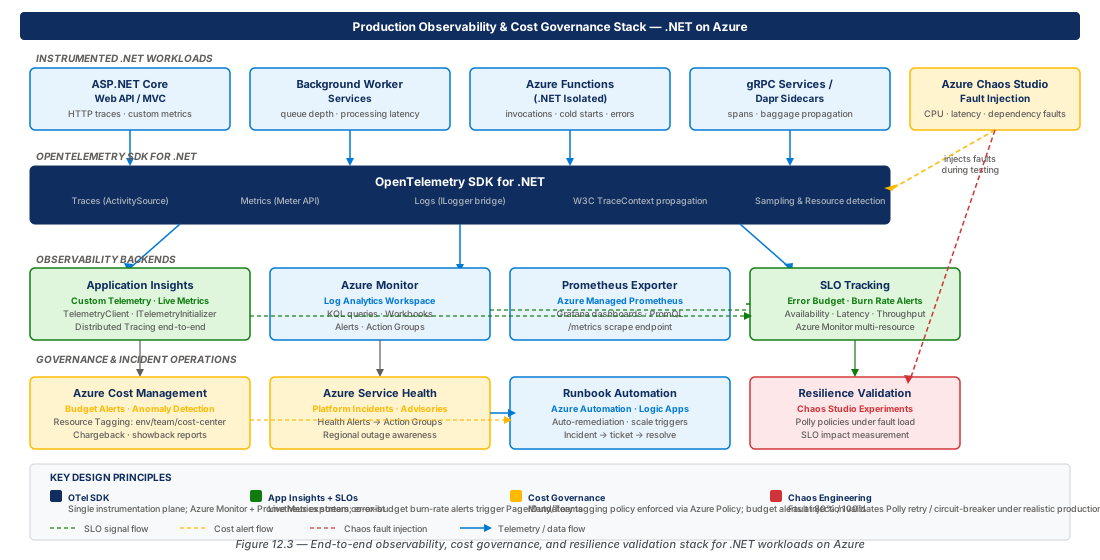
Confidence in resilience cannot be established by code review alone. The only way to verify that a circuit breaker opens correctly, or that a retry policy degrades gracefully, is to inject the failure condition in a controlled environment and observe the system's response. Azure Chaos Studio is Microsoft's managed fault injection platform that enables structured chaos experiments against Azure resources and AKS workloads without requiring infrastructure changes.
Chaos Engineering Principles and Experiment Design
Chaos engineering is hypothesis-driven experimentation. A properly designed experiment states a hypothesis, defines success criteria (e.g., P99 latency increases by no more than 200ms), and specifies blast radius (faults injected against 20% of instances, 10-minute duration, automatic rollback on breach of abort criteria). Chaos Studio provides two fault categories: service-direct faults (target Azure resource APIs, no agent required) and agent-based faults (run inside VM or AKS pod for CPU stress, memory pressure, network packet loss).
Note
Always configure abort criteria on every Chaos Studio experiment. An abort criterion halts the experiment automatically if a specified metric breaches a threshold, preventing a misconfigured fault from causing an unplanned outage. The minimum RBAC requirements are Azure Chaos Studio Operator on the target resource and Chaos Studio Contributor on the experiment resource.
Configuring and Executing a Chaos Experiment
The following CLI block onboards an App Service as a Chaos Studio target and creates a 5-minute stop experiment to validate that the application's upstream load balancer correctly routes traffic away from the stopped instance:
# Onboard App Service and enable Stop capability
az rest --method PUT \
  --url "https://management.azure.com${APP_RESOURCE_ID}/providers/Microsoft.Chaos/targets/Microsoft-AppService?api-version=2023-11-01" \
  --body '{"properties": {}}'

az rest --method PUT \
  --url "https://management.azure.com${APP_RESOURCE_ID}/providers/Microsoft.Chaos/targets/Microsoft-AppService/capabilities/Stop-1.0?api-version=2023-11-01" \
  --body '{"properties": {}}'

# Start experiment
az rest --method POST \
  --url "https://management.azure.com/subscriptions/$SUBSCRIPTION_ID/resourceGroups/$RG/providers/Microsoft.Chaos/experiments/${EXPERIMENT_NAME}/start?api-version=2023-11-01"
Interpreting Experiment Results and Closing Resilience Gaps
An experiment result is the comparison of the system's actual behavior against the stated hypothesis — not the fault execution log. When an experiment reveals a gap, remediation typically falls into: missing or misconfigured Polly resilience policies, insufficient instance count for failover capacity, missing health probes that leave failed instances in the load balancer rotation, or synchronous dependency calls that should be converted to asynchronous message-based interactions.
Tip
Run chaos experiments on a sprint cadence, not just project milestones. Resilience properties erode as code changes — a Polly policy configured correctly in Sprint 1 may be inadvertently overridden by a dependency upgrade in Sprint 15. Integrate experiment execution into your CI/CD pipeline's post-deployment validation gate using the Chaos Studio REST API.
Lab
Two labs cover the full production operations stack. CE-23 provisions the observability infrastructure; CE-24 layers on SLO alerting, cost budgets, and a Chaos Studio resilience experiment.
CE-23: Deploying the Full Observability Stack with OpenTelemetry and Azure Monitor
Provisions Log Analytics workspace (CapacityReservation), workspace-based Application Insights, Azure Monitor workspace for Prometheus, Azure Managed Grafana, and an App Service with Key Vault reference for the connection string. Run the script in sequence; each step outputs resource IDs needed by subsequent steps.
# CE-23: Full observability stack — abbreviated key steps
LOCATION="eastus2"; RG_PROD="rg-production-operations-cost-optimization-prod-001"
az group create --name "$RG_PROD" --location "$LOCATION" \
  --tags environment=prod workload=production-operations cost-center=platform-engineering
az monitor log-analytics workspace create --resource-group "$RG_PROD" \
  --workspace-name "law-production-operations-prod-eastus2-001" \
  --sku CapacityReservation --capacity-reservation-level 100 --retention-time 90
az monitor app-insights component create --app "appi-production-operations-prod-eastus2-001" \
  --resource-group "$RG_PROD" --workspace "law-production-operations-prod-eastus2-001"
az grafana create --name "amg-production-operations-prod-eastus2-001" \
  --resource-group "$RG_PROD" --sku Standard --grafana-major-version 10
# ... see full script in chapter source for Key Vault + App Service stepsCE-24: SLO Alerting, Cost Budgets, and Chaos Experiment Validation
Configures availability and P95 latency SLO alert rules on Application Insights, creates tiered production and dev cost budgets, onboards the App Service as a Chaos Studio target, runs a 5-minute stop experiment, and queries Application Insights availability metrics during the fault window. Validates that the SLO alert fires and budget notifications route correctly before concluding.
# CE-24: SLO availability alert + chaos experiment start
az monitor metrics alert create --resource-group "$RG_PROD" \
  --name "alert-slo-availability-breach-prod-001" --scopes "$AI_ID" \
  --condition "avg availabilityResults/availabilityPercentage < 99.5" \
  --window-size 5m --severity 1 --action "$AG_ONCALL_ID"

# Start chaos experiment and poll status
az rest --method POST \
  --url "https://management.azure.com/subscriptions/$SUBSCRIPTION_ID/resourceGroups/$RG_PROD/providers/Microsoft.Chaos/experiments/${EXPERIMENT_NAME}/start?api-version=2023-11-01"
# Query Application Insights requests table for fault window availability
Summary
This chapter closed the book by operationalizing all twelve chapters' worth of .NET Azure architecture into a production-ready operations and governance posture. The table below captures the key takeaways:
| Concept | Key Point |
|---|---|
| OpenTelemetry SDK for .NET | Use Azure.Monitor.OpenTelemetry.AspNetCore for OTLP export; add AddPrometheusExporter() for dual export to Azure Managed Grafana via PromQL. |
| Sampling strategy | Head-based sampling at 25% reduces Application Insights ingestion by 75%; use tail-based sampling via OTel Collector sidecar when all error traces must be captured. |
| Custom telemetry | Combine ActivitySource span events for trace-level milestones with TelemetryClient.TrackEvent for business analytics; never log PII in span attributes. |
| SLO design | Express as "X% of requests meet criterion Y over rolling Z-day window"; gate high-risk deployments when error budget is below 20% remaining. |
| Service Health integration | Route platform degradations, maintenance, and advisories to separate action groups with distinct response policies via Activity Log alert rules. |
| Cost governance | Enforce tag coverage via Azure Policy Deny + Modify; set tiered budget alerts at 80%, 100%, and 110% forecast; migrate Log Analytics to commitment tier above 100 GB/day. |
| Chaos engineering | Run hypothesis-driven experiments with defined abort criteria; progress from diagnostic collection to automated remediation only after 90 days of validated outcomes. |
Chapter: 12 of 12 | Status: v0.1 Draft |