Monitoring, Observability, and Cost Governance
End-to-end visibility, alert engineering, and financial accountability for production integration estates.
Distributed integration estates are only as reliable as the visibility you maintain over them. An Azure integration platform spanning API Management, Logic Apps, Service Bus, and Event Hubs creates dozens of independently scalable components whose failures cascade silently unless telemetry is deliberately correlated end-to-end. This chapter operationalizes that estate with production-grade observability—connecting distributed traces across service boundaries, constructing actionable dashboards, tuning alert rules to the signals that matter, attributing cost to the workloads that incur it, and applying systematic benchmarking to keep right-sizing decisions evidence-based rather than intuition-driven.
Foundations of Integration Observability
The Observability Triad in an Integration Context
Observability is not a synonym for monitoring. Monitoring asks "is this component up?" whereas observability asks "why is this integration workflow behaving this way?" The distinction matters enormously in a multi-service estate because a Logic App run can appear successful while silently discarding a message that failed validation in an upstream APIM policy. The three pillars—metrics, logs, and traces—each answer a different facet of that question, and all three must be present before you can claim true observability.
Metrics are time-series aggregates: throughput, error rates, latency percentiles, and queue depths. They are cheap to store, fast to query, and ideal for alerting. However, metrics alone cannot tell you which customer's order triggered a 503, nor can they reveal that the latency spike is in the Logic Apps HTTP action rather than the backend. Logs provide the per-event record that fills this gap, capturing the structured context—correlation identifiers, payload fragments, policy decisions—that transforms a metric anomaly into a diagnosable incident. Traces connect those log events into a causal chain that spans service boundaries, so you can follow a single transaction from the APIM gateway through the Logic App orchestration to the Service Bus consumer and back.
In Azure integration workloads, the natural home for all three pillars is a Log Analytics workspace backed by Application Insights. Application Insights provides the SDK and ingestion pipeline for distributed tracing, while Log Analytics provides the queryable store and the foundation for Azure Monitor workbooks and alerts. Provisioning these as a single linked pair—rather than as separate resources—gives you cross-resource Kusto queries without requiring workspace federation, which simplifies both the data model and the IAM surface.
Workspace Architecture and Resource Topology
A production integration monitoring estate requires deliberate workspace topology decisions before a single byte of telemetry is ingested. The most common mistake is creating one Application Insights resource per integration service, which produces correlation dead-ends: the operation_Id generated by APIM is not propagated to the Logic App because the two resources use separate instrumentation keys and have no shared sampling policy.
The recommended topology uses a single regional Log Analytics workspace as the backing store for all Application Insights resources in a given environment. Each integration service (APIM, Logic Apps, Service Bus) sends diagnostics to this workspace, while a single Application Insights resource—configured in workspace-based mode—ingests SDK telemetry from custom connectors and integration adapters. This arrangement enables the union operator in KQL to query across requests, dependencies, traces, and exceptions tables in a single query, with operation_Id serving as the join key across all tables.
For multi-region estates, replicate the topology per region rather than attempting cross-region workspace federation. Cross-region queries introduce latency and egress costs, and incidents are almost always regional in scope. A global Azure Monitor alert rule can fan out to regional workspaces by using linked scopes.
# CE-18 (prerequisite): Provision the monitoring workspace topology
# Creates a workspace-based Application Insights resource linked to a
# shared Log Analytics workspace for unified integration telemetry.

RESOURCE_GROUP="rg-monitoring-observability-cost-prod-001"
LOCATION="eastus2"
WORKSPACE_NAME="log-integration-prod-eastus2-001"
APPINSIGHTS_NAME="appi-monitoring-observability-prod-eastus2-001"

# Create resource group
az group create \
  --name "$RESOURCE_GROUP" \
  --location "$LOCATION" \
  --tags \
    environment=production \
    workload=integration-monitoring \
    costCenter=platform-engineering \
    owner=azure-integration-team

# Create Log Analytics workspace with 90-day retention
az monitor log-analytics workspace create \
  --resource-group "$RESOURCE_GROUP" \
  --workspace-name "$WORKSPACE_NAME" \
  --location "$LOCATION" \
  --sku PerGB2018 \
  --retention-time 90 \
  --tags \
    environment=production \
    workload=integration-monitoring \
    costCenter=platform-engineering

WORKSPACE_ID=$(az monitor log-analytics workspace show \
  --resource-group "$RESOURCE_GROUP" \
  --workspace-name "$WORKSPACE_NAME" \
  --query id --output tsv)

# Create workspace-based Application Insights
az monitor app-insights component create \
  --app "$APPINSIGHTS_NAME" \
  --location "$LOCATION" \
  --resource-group "$RESOURCE_GROUP" \
  --workspace "$WORKSPACE_ID" \
  --application-type web \
  --tags \
    environment=production \
    workload=integration-monitoring \
    costCenter=platform-engineering

echo "Workspace ID: $WORKSPACE_ID"
echo "AppInsights created: $APPINSIGHTS_NAME"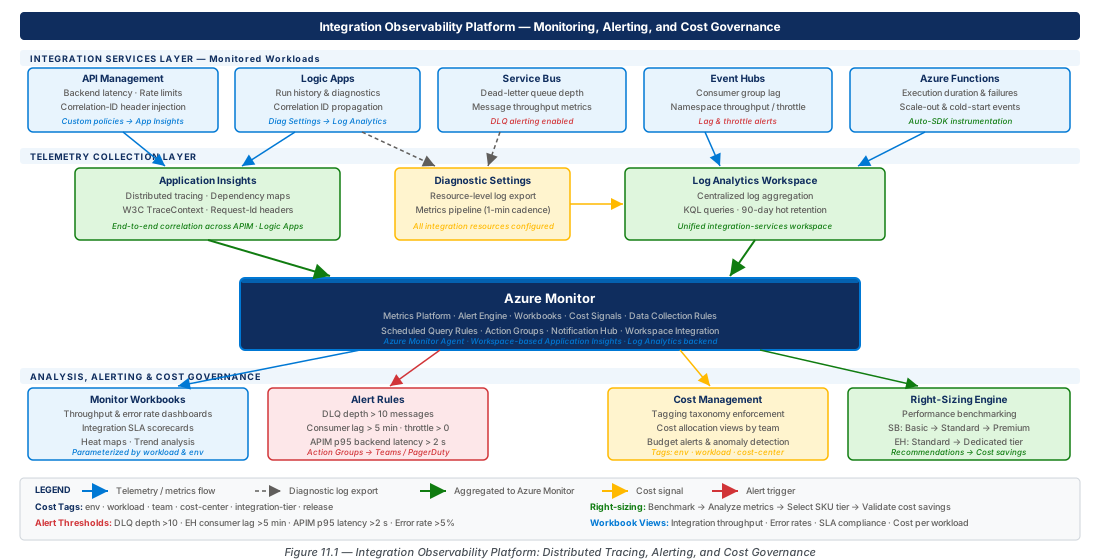
operation_Id.Distributed Tracing with Application Insights Correlation IDs
Correlation Architecture Across APIM and Logic Apps
Distributed tracing in Azure integration services depends on a single shared identifier—operation_Id—flowing unmodified from the entry point of a request through every downstream service that participates in fulfilling it. When APIM receives an inbound HTTP request, it generates a W3C traceparent header (format: 00-{traceId}-{spanId}-{flags}) if one is not already present. This traceId becomes the operation_Id in Application Insights telemetry and must be propagated explicitly to every downstream service call, including Logic App HTTP triggers, Service Bus messages, and Event Hubs events.
The critical failure mode is header stripping. Many integration middleware components—load balancers, WAFs, OAuth token exchange endpoints—strip or rewrite custom headers, silently breaking the trace chain. APIM's set-header policy can defensively re-inject the traceparent header on outbound requests to Logic App HTTP triggers, ensuring that even if the header was stripped by an intermediate component, it is re-established before the Logic App records its telemetry. The Logic App then reads traceparent from the incoming request and writes it as the clientTrackingId in its run history, which Application Insights picks up as operation_Id when the Logic App diagnostics are streamed to the Log Analytics workspace.
APPINSIGHTS_INSTRUMENTATIONKEY and APPLICATIONINSIGHTS_CONNECTION_STRING environment variables. Logic Apps Consumption sends diagnostics to Log Analytics via a Diagnostic Settings resource. The telemetry schema differs: Standard emits requests and dependencies table entries like a web application, while Consumption emits custom events to the logicAppRuntime table. Your KQL queries must account for this difference if you run both tiers.
For Service Bus and Event Hubs, correlation propagation must be explicit. When APIM or a Logic App publishes a message, it must write the operation_Id as a user property on the Service Bus message (Diagnostic-Id is the conventional property name) or as an Event Hubs event property. The consuming Logic App or Azure Function then reads this property and sets it as the outgoing operation identifier before performing any subsequent work. Without this step, the consuming service generates a fresh operation_Id, and the trace chain appears to terminate at the broker.
Configuring APIM Diagnostic Settings for Correlation
APIM's Application Insights integration is configured at two levels: the service level (applying to all APIs) and the per-API level (overriding the service default). For integration workloads, the most important settings are the sampling rate, the verbosity of logged headers, and whether to log request and response bodies. In production, logging full bodies is rarely appropriate—it inflates Log Analytics ingestion costs and may capture PII—but logging a defined subset of headers including traceparent, x-correlation-id, and x-request-id is essential for trace reconstruction.
The sampling property controls what fraction of requests generate Application Insights telemetry. At 100% sampling, every APIM request produces a request record in Application Insights. For high-volume APIs exceeding 1,000 requests per second, 100% sampling is prohibitively expensive; a 10% sample with adaptive sampling is more appropriate. However, for critical integration paths where every failed transaction must be diagnosable, configure the log-to-eventhub policy to selectively emit full telemetry for 4xx and 5xx responses regardless of the sampling rate.
# CE-19 (prerequisite): Configure APIM diagnostic settings with correlation
# Enables Application Insights integration on the APIM instance with
# header logging for distributed trace propagation.

RESOURCE_GROUP="rg-monitoring-observability-cost-prod-001"
APIM_NAME="apim-integration-prod-eastus2-001"
APPINSIGHTS_NAME="appi-monitoring-observability-prod-eastus2-001"

# Get Application Insights instrumentation key
APPINSIGHTS_KEY=$(az monitor app-insights component show \
  --app "$APPINSIGHTS_NAME" \
  --resource-group "$RESOURCE_GROUP" \
  --query instrumentationKey --output tsv)

APPINSIGHTS_ID=$(az monitor app-insights component show \
  --app "$APPINSIGHTS_NAME" \
  --resource-group "$RESOURCE_GROUP" \
  --query id --output tsv)

# Create Application Insights logger in APIM
az apim logger create \
  --resource-group "$RESOURCE_GROUP" \
  --service-name "$APIM_NAME" \
  --logger-id "appinsights-integration-logger" \
  --logger-type applicationInsights \
  --credentials "instrumentationKey=$APPINSIGHTS_KEY" \
  --description "Application Insights logger for integration correlation"

# Configure APIM diagnostic settings for Application Insights
APIM_RESOURCE_ID=$(az apim show \
  --name "$APIM_NAME" \
  --resource-group "$RESOURCE_GROUP" \
  --query id --output tsv)

az rest --method put \
  --uri "${APIM_RESOURCE_ID}/diagnostics/applicationinsights?api-version=2022-08-01" \
  --body '{
    "properties": {
      "loggerId": "/subscriptions/'"$(az account show --query id -o tsv)"'/resourceGroups/'"$RESOURCE_GROUP"'/providers/Microsoft.ApiManagement/service/'"$APIM_NAME"'/loggers/appinsights-integration-logger",
      "alwaysLog": "allErrors",
      "sampling": {
        "samplingType": "fixed",
        "percentage": 100
      },
      "verbosity": "information",
      "logClientIp": false,
      "httpCorrelationProtocol": "W3C",
      "frontend": {
        "request": {
          "headers": ["traceparent","x-correlation-id","x-request-id","x-ms-client-tracking-id"],
          "body": { "bytes": 0 }
        },
        "response": {
          "headers": ["x-correlation-id","x-ms-request-id"],
          "body": { "bytes": 0 }
        }
      },
      "backend": {
        "request": {
          "headers": ["traceparent","x-correlation-id"],
          "body": { "bytes": 0 }
        },
        "response": {
          "headers": ["x-ms-request-id"],
          "body": { "bytes": 0 }
        }
      }
    }
  }'

echo "APIM diagnostic settings configured with W3C correlation and header logging"
Correlation Query Patterns in KQL
Once correlation identifiers flow consistently across services, the value is realized through KQL queries that reconstruct end-to-end transaction timelines. The most useful query for integration diagnostics joins APIM request telemetry with Logic App run history and Service Bus consumer activity on operation_Id, rendering a unified waterfall view of a single business transaction.
The following pattern is the foundation for integration trace reconstruction. It unions requests from APIM, dependencies emitted by Logic Apps Standard, and custom trace events from integration adapters, then groups them by operation_Id and sorts by timestamp to produce a transaction timeline.
// End-to-end integration transaction trace
// Replace <operation_id> with the actual correlation ID under investigation
let target_operation = "<operation_id>";
union requests, dependencies, traces, exceptions
| where operation_Id == target_operation
  or customDimensions["x-correlation-id"] == target_operation
| extend
    service_name = cloud_RoleName,
    event_type = itemType,
    duration_ms = toint(duration),
    status = case(
        itemType == "request", tostring(resultCode),
        itemType == "dependency", iff(success == true, "OK", "FAILED"),
        "N/A"
    )
| project timestamp, service_name, event_type, name, status, duration_ms,
          operation_Id, operation_ParentId, customDimensions
| order by timestamp asc
For operational dashboards that need aggregate correlation quality metrics—the percentage of requests that successfully propagate a correlation ID end-to-end—the following pattern samples APIM requests and checks whether a matching Logic App execution exists within the expected latency window:
// Correlation coverage metric: % of APIM requests with traceable Logic App execution
let time_range = 1h;
let apim_requests = requests
| where timestamp > ago(time_range)
  and cloud_RoleName contains "apim"
  and name has "integration"
| project operation_Id, apim_timestamp = timestamp, apim_status = resultCode;
let logic_app_runs = requests
| where timestamp > ago(time_range)
  and cloud_RoleName contains "logic"
| project operation_Id, la_timestamp = timestamp, la_status = resultCode;
apim_requests
| join kind=leftouter logic_app_runs on operation_Id
| summarize
    total_requests = count(),
    correlated_requests = countif(isnotempty(la_timestamp)),
    uncorrelated_requests = countif(isempty(la_timestamp))
| extend correlation_coverage_pct = round(100.0 * correlated_requests / total_requests, 1)
| project total_requests, correlated_requests, uncorrelated_requests, correlation_coverage_pctcorrelation_coverage_pct as a leading indicator of observability health. A value below 95% typically indicates header stripping by an intermediate component or a Logic App that is not forwarding the traceparent header to its outbound HTTP actions. Investigate by querying for APIM requests whose operation_Id has no matching entry in the Logic App telemetry to identify the specific request patterns breaking the chain.
Azure Monitor Workbooks for Integration Health Dashboards
Workbook Architecture and Template Design Principles
Azure Monitor workbooks are the natural home for integration health dashboards because they combine live KQL queries, parameter-driven filtering, and rich visualizations in a single shareable artifact stored as an Azure resource. Unlike pinned Azure Monitor dashboard tiles—which are static and cannot share query parameters—workbooks support dynamic parameter binding, conditional rendering, and multi-step query chains where the output of one query becomes the filter input for the next. This capability is essential for integration dashboards where an operator wants to click on a failing API in the throughput overview and drill down to the error distribution for that specific API without navigating to a new view.
Workbook design for integration estates follows a three-tier pattern: an executive overview tier showing aggregated health scores, a service-tier breakdown showing per-service throughput and error rates, and a transaction investigation tier showing individual correlation chains. Each tier is a separate workbook section linked by parameter pass-through. The executive tier uses metric-backed queries for near-real-time latency (metric queries have sub-minute resolution, while Log Analytics queries are subject to ingestion delay of 2–5 minutes). The service and transaction tiers use KQL queries against Log Analytics for richer contextual data.
az monitor app-insights workbook export and store it in your infrastructure-as-code repository. This ensures the dashboard definition is version-controlled and can be deployed to new environments consistently.
Parameter design is the most consequential architectural decision in a workbook. The recommended parameter set for an integration health workbook is: TimeRange (default: last 4 hours), Environment (production/staging/development), IntegrationDomain (multi-select enum of business domain tags), and SeverityThreshold (error rate percentage above which services appear highlighted). These four parameters provide sufficient filtering granularity without requiring per-service selection.
Building the Throughput and Error Rate Dashboard
The throughput and error rate dashboard is the most-referenced operational artifact for an integration estate. It must answer three questions at a glance: Is overall throughput within normal bounds? Which services are experiencing elevated error rates? How does current performance compare to the baseline for this time of day and day of week?
Answering the third question requires a baseline comparison query that computes the expected throughput for the current hour using historical data from the same hour on the same day of the prior four weeks. This seasonality-aware baseline distinguishes a genuine throughput drop from expected business-hours variation—a capability that flat threshold alerts fundamentally cannot provide.
# CE-20 (prerequisite): Deploy the integration health workbook template
# Creates an Azure Monitor workbook in the monitoring resource group
# using a parameterized ARM template for the integration health dashboard.

RESOURCE_GROUP="rg-monitoring-observability-cost-prod-001"
WORKSPACE_NAME="log-integration-prod-eastus2-001"
LOCATION="eastus2"

WORKSPACE_ID=$(az monitor log-analytics workspace show \
  --resource-group "$RESOURCE_GROUP" \
  --workspace-name "$WORKSPACE_NAME" \
  --query id --output tsv)

# Deploy workbook via ARM template
az deployment group create \
  --resource-group "$RESOURCE_GROUP" \
  --template-file "./workbook-integration-health.json" \
  --parameters \
    workbookDisplayName="Integration Health Dashboard - Production" \
    workbookSourceId="$WORKSPACE_ID" \
    location="$LOCATION" \
    environment="production" \
    costCenter="platform-engineering" \
  --name "deploy-integration-workbook-$(date +%Y%m%d%H%M%S)"

echo "Integration health workbook deployed to $RESOURCE_GROUP"
The core throughput query for the workbook computes requests per minute grouped by integration service, with a rolling 5-minute average to smooth spikes:
// Integration throughput by service — workbook tile query
// Parameters: {TimeRange} from workbook parameter, {IntegrationDomain} multi-select
requests
| where timestamp {TimeRange}
  and cloud_RoleName in ({IntegrationDomain})
| summarize
    requests_per_min = count() / (totimespan({TimeRange}) / 1m),
    p50_latency_ms = percentile(duration, 50),
    p95_latency_ms = percentile(duration, 95),
    p99_latency_ms = percentile(duration, 99),
    error_rate_pct = 100.0 * countif(success == false) / count()
  by cloud_RoleName, bin(timestamp, 5m)
| render timechart
The companion error rate heatmap query uses the summarize operator to produce a two-dimensional matrix of service-by-hour error rates, which renders as a heatmap visualization in the workbook grid component. Values are color-coded from green (0%) through yellow (2%) to red (5%+), giving operations staff an immediate visual cue of which services and which time windows require investigation.
bin() time boundary frequently exceed the Log Analytics 30-second query timeout, causing workbook tiles to render empty with a timeout error. Always include a bin(timestamp, 1h) or coarser for queries spanning more than 24 hours, and set the workbook parameter maximum time range to 7 days.
Alert Rules for Integration Service Health Signals
Alert Strategy and Noise Reduction
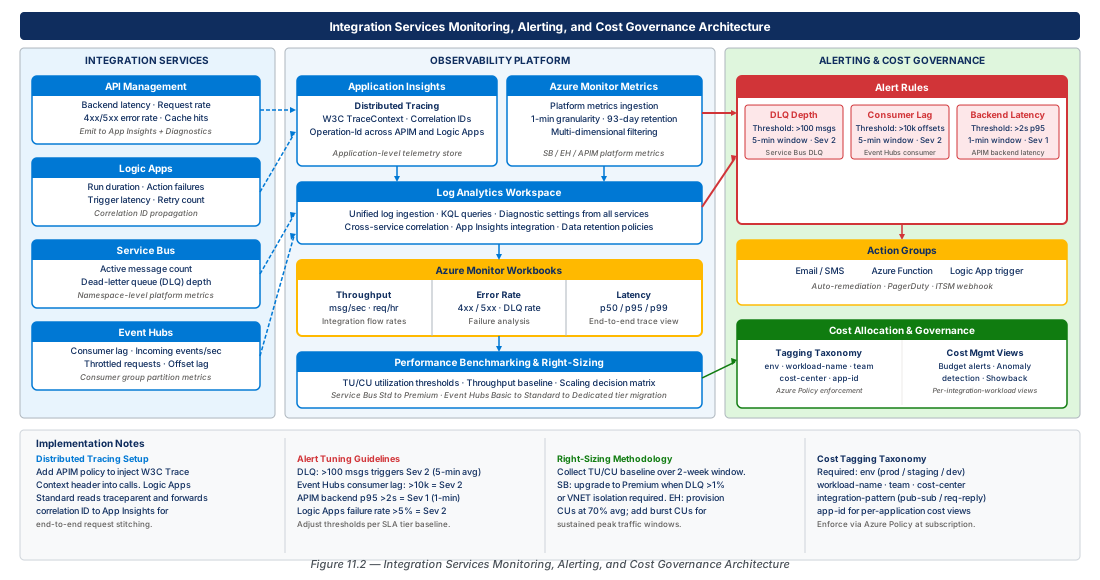
Alert fatigue is the primary failure mode of integration monitoring programs. An estate with forty integration services producing twenty alert rules each generates eight hundred potential alert conditions, and the operations team that receives hundreds of notifications per day stops treating any of them as urgent. The solution is not to have fewer alerts—it is to have fewer, higher-quality alerts with well-defined severity classifications and clearly documented response playbooks.
The alert taxonomy for integration services follows four severity levels. Severity 0 (Critical) means a production business process is completely halted—a dead-letter queue that has grown beyond its retry budget, an Event Hubs consumer group with zero active receivers, or APIM returning 100% 5xx for a critical API. Severity 1 (High) means performance degradation that will soon become critical. Severity 2 (Medium) signals early-warning conditions that warrant investigation within a business day. Severity 3 (Low) captures informational conditions for SRE review.
For each severity level, the alert rule must specify a suppression window to prevent flapping. The recommended suppression for Severity 0 is 15 minutes and for Severity 1 is 30 minutes.
Dead-Letter Queue Depth Alerts
Service Bus dead-letter queues are the most important alerting surface for message-based integration because a growing DLQ is the definitive signal that messages are being processed incorrectly rather than simply being delayed. The DLQ depth metric is DeadLetteredMessages in the Service Bus namespace metrics, available at 1-minute resolution. The most reliable alerting pattern uses a Log Analytics scheduled query alert that computes DLQ drain rate over a 15-minute window and fires when the depth has increased by more than a configurable threshold during that window.
# CE-21: Deploy dead-letter queue depth alert rule
# Creates a metric alert on Service Bus DLQ depth with a static threshold
# and a scheduled query alert for sustained DLQ growth rate detection.

RESOURCE_GROUP="rg-monitoring-observability-cost-prod-001"
SERVICEBUS_NAMESPACE="sb-integration-prod-eastus2-001"
ACTION_GROUP_NAME="ag-integration-ops-prod-001"
WORKSPACE_NAME="log-integration-prod-eastus2-001"

SB_RESOURCE_ID=$(az servicebus namespace show \
  --name "$SERVICEBUS_NAMESPACE" \
  --resource-group "$RESOURCE_GROUP" \
  --query id --output tsv)

WORKSPACE_ID=$(az monitor log-analytics workspace show \
  --resource-group "$RESOURCE_GROUP" \
  --workspace-name "$WORKSPACE_NAME" \
  --query id --output tsv)

# Create action group for integration operations team
az monitor action-group create \
  --resource-group "$RESOURCE_GROUP" \
  --name "$ACTION_GROUP_NAME" \
  --short-name "IntOps" \
  --email-receivers \
    name="IntegrationOpsEmail" \
    email-address="integration-ops@contoso.com" \
  --tags \
    environment=production \
    workload=integration-monitoring \
    costCenter=platform-engineering

ACTION_GROUP_ID=$(az monitor action-group show \
  --resource-group "$RESOURCE_GROUP" \
  --name "$ACTION_GROUP_NAME" \
  --query id --output tsv)

# Severity 0: absolute DLQ depth threshold (>= 50 messages)
az monitor metrics alert create \
  --name "alert-sb-dlq-depth-critical-prod-001" \
  --resource-group "$RESOURCE_GROUP" \
  --scopes "$SB_RESOURCE_ID" \
  --condition "avg DeadLetteredMessages >= 50" \
  --description "Service Bus DLQ depth exceeded critical threshold of 50 messages" \
  --severity 0 \
  --window-size 5m \
  --evaluation-frequency 1m \
  --auto-mitigate true \
  --action "$ACTION_GROUP_ID" \
  --tags environment=production alertSeverity=critical workload=integration-monitoring

# Severity 1: scheduled query for sustained DLQ growth rate
az monitor scheduled-query create \
  --name "alert-sb-dlq-growthrate-high-prod-001" \
  --resource-group "$RESOURCE_GROUP" \
  --scopes "$WORKSPACE_ID" \
  --condition-query \
    "AzureMetrics
     | where ResourceId contains 'sb-integration-prod-eastus2-001'
       and MetricName == 'DeadLetteredMessages'
     | summarize dlq_start = min(Average), dlq_end = max(Average) by bin(TimeGenerated, 15m)
     | extend dlq_growth = dlq_end - dlq_start
     | where dlq_growth > 5" \
  --condition-time-aggregation Count \
  --condition-operator GreaterThan \
  --condition-threshold 0 \
  --description "Service Bus DLQ growing by more than 5 messages in 15 minutes" \
  --severity 1 \
  --window-duration PT15M \
  --evaluation-frequency PT5M \
  --action-groups "$ACTION_GROUP_ID" \
  --tags environment=production alertSeverity=high workload=integration-monitoring

echo "DLQ alert rules deployed for $SERVICEBUS_NAMESPACE"
Event Hubs Consumer Lag and APIM Backend Latency Alerts
Event Hubs consumer lag—the gap between the newest offset in a partition and the last committed offset of a consumer group—is the primary operational health indicator for streaming integration workloads. A consumer lag of zero means the consumer is keeping up with the producer in real time. Rising consumer lag means the consumer is falling behind, and if the lag exceeds the retention period, messages will be permanently lost. No other integration failure has a harder recovery path than message loss due to retention expiry.
Alert rules should operate at the consumer group level (summing across partitions) rather than the partition level to avoid alert storms during partition rebalancing. For APIM backend latency, alert on the BackendDuration metric rather than total request duration, because the total duration includes time spent in APIM policies. Use dynamic thresholds for backend latency to account for normal variation across different operation types.
# CE-22: Deploy Event Hubs consumer lag and APIM backend latency alerts

RESOURCE_GROUP="rg-monitoring-observability-cost-prod-001"
EVENTHUBS_NAMESPACE="evhns-integration-prod-eastus2-001"
APIM_NAME="apim-integration-prod-eastus2-001"

EH_RESOURCE_ID=$(az eventhubs namespace show \
  --name "$EVENTHUBS_NAMESPACE" \
  --resource-group "$RESOURCE_GROUP" \
  --query id --output tsv)

APIM_RESOURCE_ID=$(az apim show \
  --name "$APIM_NAME" \
  --resource-group "$RESOURCE_GROUP" \
  --query id --output tsv)

ACTION_GROUP_ID=$(az monitor action-group show \
  --resource-group "$RESOURCE_GROUP" \
  --name "ag-integration-ops-prod-001" \
  --query id --output tsv)

# Event Hubs consumer lag — static threshold for critical backlog
az monitor metrics alert create \
  --name "alert-eh-consumerlag-critical-prod-001" \
  --resource-group "$RESOURCE_GROUP" \
  --scopes "$EH_RESOURCE_ID" \
  --condition "avg ConsumerLag >= 100000" \
  --description "Event Hubs consumer lag exceeds 100,000 events" \
  --severity 1 \
  --window-size 10m \
  --evaluation-frequency 5m \
  --auto-mitigate true \
  --action "$ACTION_GROUP_ID"

# Event Hubs: no active receivers (consumer group has zero connections)
az monitor metrics alert create \
  --name "alert-eh-noreceiver-critical-prod-001" \
  --resource-group "$RESOURCE_GROUP" \
  --scopes "$EH_RESOURCE_ID" \
  --condition "avg ActiveConnections < 1" \
  --description "Event Hubs has no active consumer connections — potential outage" \
  --severity 0 \
  --window-size 5m \
  --evaluation-frequency 1m \
  --auto-mitigate true \
  --action "$ACTION_GROUP_ID"

# APIM backend latency — dynamic threshold
az monitor metrics alert create \
  --name "alert-apim-backend-latency-high-prod-001" \
  --resource-group "$RESOURCE_GROUP" \
  --scopes "$APIM_RESOURCE_ID" \
  --condition "avg BackendDuration > DynamicThreshold" \
  --condition-sensitivity High \
  --description "APIM backend latency exceeds dynamic baseline" \
  --severity 2 \
  --window-size 15m \
  --evaluation-frequency 5m \
  --auto-mitigate true \
  --action "$ACTION_GROUP_ID"

# APIM error rate — static threshold for 5xx responses
az monitor metrics alert create \
  --name "alert-apim-5xx-rate-critical-prod-001" \
  --resource-group "$RESOURCE_GROUP" \
  --scopes "$APIM_RESOURCE_ID" \
  --condition "avg FailedRequests >= 10" \
  --description "APIM is returning 10+ failed requests per minute" \
  --severity 1 \
  --window-size 5m \
  --evaluation-frequency 1m \
  --auto-mitigate true \
  --action "$ACTION_GROUP_ID"

echo "Event Hubs and APIM alert rules deployed"
The following table summarizes the complete alert rule set for a production integration estate:
| Signal | Metric / Query | Threshold Type | Recommended Threshold | Severity | Window | Frequency |
|---|---|---|---|---|---|---|
| Service Bus DLQ Depth | DeadLetteredMessages | Static | ≥ 50 messages | 0 (Critical) | 5 min | 1 min |
| Service Bus DLQ Growth Rate | Scheduled query (KQL) | Static | > 5 new DLQ msgs / 15 min | 1 (High) | 15 min | 5 min |
| Event Hubs Consumer Lag | ConsumerLag | Static | ≥ 100,000 events | 1 (High) | 10 min | 5 min |
| Event Hubs Active Receivers | ActiveConnections | Static | < 1 connection | 0 (Critical) | 5 min | 1 min |
| APIM Backend Latency | BackendDuration | Dynamic | High sensitivity | 2 (Medium) | 15 min | 5 min |
| APIM Failed Requests | FailedRequests | Static | ≥ 10 per minute | 1 (High) | 5 min | 1 min |
| Logic App Run Failure Rate | RunsFailed / RunsTotal | Dynamic | Medium sensitivity | 2 (Medium) | 10 min | 5 min |
| Logic App Run Throttled | RunsThrottled | Static | ≥ 1 throttle per 5 min | 1 (High) | 5 min | 5 min |
Cost Allocation Tagging and Azure Cost Management
Tagging Taxonomy for Integration Workloads
Cost accountability in a multi-tenant integration platform requires that every Azure resource carry a consistent set of resource tags that enable cost attribution to the business domain, application, environment, and financial owner that incurred the cost. Without this taxonomy, integration platform costs appear as an undifferentiated "platform engineering" line in the Azure bill, which makes right-sizing negotiations impossible and creates perverse incentives for business domains to over-consume shared integration resources since they bear no visible portion of the cost.
The recommended tag taxonomy for integration workloads comprises seven mandatory tags and three optional tags. Mandatory tags must be enforced via Azure Policy with deny effect on resource creation. The costCenter tag maps to the financial ledger code for chargeback processing. The workload tag identifies the logical integration workload (e.g., order-processing-integration) and enables cost views grouped by business capability. The integrationDomain tag is specific to integration estates and identifies the business domain served by this resource (e.g., supply-chain, finance, hr). The dataClassification tag identifies whether the resource processes regulated data (PII, PCI, HIPAA).
| Tag Name | Required | Example Values | Enforcement Policy | Cost Management Usage |
|---|---|---|---|---|
environment | Yes | production, staging, development | Deny on create | Environment efficiency ratio view |
workload | Yes | order-processing-integration | Deny on create | Workload cost comparison view |
integrationDomain | Yes | supply-chain, finance, hr | Deny on create | Domain cost allocation view |
costCenter | Yes | CC-12345, CC-67890 | Deny on create | Financial chargeback processing |
owner | Yes | team@contoso.com | Deny on create | Cost anomaly notification routing |
dataClassification | Yes | public, internal, confidential, regulated | Deny on create | Compliance cost premium analysis |
projectCode | No | PRJ-2026-042 | Audit | Capital expenditure attribution |
expiryDate | Non-prod only | 2026-12-31 | Deny on non-prod create | Automated resource cleanup |
supportTeam | No | integration-platform-sre | Audit | Incident routing |
Azure Cost Management Views for Integration Workloads
Azure Cost Management provides the query and visualization layer that transforms tag data into actionable cost attribution. The key views for an integration estate are the integration domain cost view (cost by integrationDomain tag over the past 30 days), the workload comparison view (month-over-month cost change by workload tag to detect unexpected growth), and the environment efficiency view (production vs. non-production cost ratio to identify over-provisioned development environments).
The integration domain cost view is constructed as a Cost Management custom view with Group by: Tag: integrationDomain and a filter on Tag: environment = production. Export this view as a scheduled email report to the integration platform product owner weekly. For cross-service cost attribution, Azure Cost Management's resource type filter enables analysis of cost per service type within a tagged workload, revealing which service dominates the workload cost.
Performance Benchmarking and Right-Sizing
Benchmarking Methodology for Messaging Services
Right-sizing Service Bus and Event Hubs namespaces is an iterative empirical process, not a one-time calculation. A systematic benchmarking methodology produces the evidence needed to justify SKU changes in both directions: upgrading before a capacity limit is reached, and downgrading when a namespace was provisioned for a workload that never materialized.
The benchmark test for a Service Bus namespace should measure three independent dimensions: throughput (messages per second sustained over a 10-minute window at peak load), latency (p50, p95, p99 send latency and receive-to-ack latency under load), and recovery behavior (time to drain a backlog of 10× normal message volume after a simulated consumer outage). Throughput scales almost linearly with Messaging Units for Premium tier namespaces; latency is dominated by geographic distance and is minimally affected by SKU within the same region.
For Event Hubs, the analogous dimensions are throughput (events per second and megabytes per second sustained), partition saturation (the fraction of partitions carrying load), and consumer group scaling (the maximum number of consumer groups reading concurrently before performance degrades). Event Hubs Standard tier scales in Throughput Units (TUs), where each TU provides 1 MB/sec inbound and 2 MB/sec outbound. Event Hubs Premium and Dedicated tiers use Processing Units (PUs) and Capacity Units (CUs) respectively, with deterministic performance isolation unavailable in the Standard tier.
Right-Sizing Recommendations and SKU Comparison
The right-sizing decision matrix for Service Bus and Event Hubs is shown in the table below. The key distinguishing factors are: whether the workload requires predictable latency (use Premium/Dedicated to eliminate noisy-neighbor effects), whether the message size exceeds 256 KB (requires Premium for Service Bus), and whether geo-disaster recovery is required (requires Premium for Service Bus, Premium/Dedicated for Event Hubs).
| Dimension | SB Basic | SB Standard | SB Premium | EH Basic | EH Standard | EH Premium | EH Dedicated |
|---|---|---|---|---|---|---|---|
| Max Message Size | 256 KB | 256 KB | 100 MB | 256 KB | 1 MB | 1 MB | 1 MB |
| Max Throughput | Shared | Shared | 1 GB/s per MU | Shared | 1 MB/s per TU in | 10 MB/s per PU | 1 CU ≈ 100 TUs |
| Pricing Model | Per operation | Per operation | Per MU-hour | Per TU | Per TU-hour | Per PU-hour | Per CU-day |
| Topics & Subscriptions | No | Yes | Yes | N/A | N/A | N/A | N/A |
| Geo-Disaster Recovery | No | No | Yes | No | Yes (Geo-Pairing) | Yes | Yes |
| Private Endpoints | No | No | Yes | No | Yes | Yes | Yes |
| CMK Encryption | No | No | Yes | No | No | Yes | Yes |
| Max Retention | 1 day | 14 days | 14 days | 1 day | 7 days | 90 days | 90 days |
| SLA | 99.9% | 99.9% | 99.9% | 99.9% | 99.9% | 99.95% | 99.99% |
| Recommended For | Dev/Test only | Low-volume | Production integration | Dev/Test only | Standard streaming | High-throughput / regulated | Mission-critical / isolated |
# CE-23: Run Service Bus namespace performance benchmark
# Uses the Azure Service Bus Stress Test tool to measure throughput and
# latency at varying message rates for right-sizing analysis.

RESOURCE_GROUP="rg-monitoring-observability-cost-dev-001"
SERVICEBUS_NAMESPACE="sb-integration-dev-eastus2-benchmark-001"
LOCATION="eastus2"

# Create a dedicated Premium namespace for benchmarking
az servicebus namespace create \
  --name "$SERVICEBUS_NAMESPACE" \
  --resource-group "$RESOURCE_GROUP" \
  --location "$LOCATION" \
  --sku Premium \
  --capacity 1 \
  --tags \
    environment=development \
    workload=performance-benchmark \
    expiryDate="2026-12-31" \
    costCenter=platform-engineering

# Create benchmark queue with optimized settings for throughput testing
az servicebus queue create \
  --name "benchmark-throughput-queue" \
  --namespace-name "$SERVICEBUS_NAMESPACE" \
  --resource-group "$RESOURCE_GROUP" \
  --max-delivery-count 3 \
  --lock-duration PT30S \
  --default-message-time-to-live P1D \
  --enable-partitioning true \
  --enable-batched-operations true

# Get connection string for benchmark tool
SB_CONNECTION_STRING=$(az servicebus namespace authorization-rule keys list \
  --resource-group "$RESOURCE_GROUP" \
  --namespace-name "$SERVICEBUS_NAMESPACE" \
  --name RootManageSharedAccessKey \
  --query primaryConnectionString --output tsv)

echo "Benchmark 1: 100 msg/s @ 1KB — establishing baseline"
echo "Benchmark 2: 500 msg/s @ 1KB — moderate load"
echo "Benchmark 3: 1000 msg/s @ 4KB — peak load simulation"

# Query benchmark results from Azure Monitor metrics
az monitor metrics list \
  --resource "$(az servicebus namespace show \
    --name "$SERVICEBUS_NAMESPACE" \
    --resource-group "$RESOURCE_GROUP" \
    --query id --output tsv)" \
  --metric "IncomingMessages,OutgoingMessages,ThrottledRequests" \
  --interval PT1M \
  --output table

echo "Benchmark complete. Review ThrottledRequests metric to identify saturation point."
echo "Right-sizing recommendation: increase MU count if ThrottledRequests > 0 at target throughput."
Interpreting Benchmark Results and Scaling Decisions
Benchmark results must be interpreted in the context of the target workload's operational envelope—not just its peak throughput, but its burst duration, message size distribution, and consumer-to-producer ratio. A namespace that handles 1,000 messages per second under a synthetic steady-state benchmark may fail at 800 messages per second under production conditions if the production workload has a bimodal message size distribution that the benchmark did not replicate.
The throttled request rate is the most important benchmark output metric. A throttled request in Service Bus means the namespace has reached its throughput limit and the client SDK is retrying. The scaling rule is: if the ThrottledRequests metric exceeds zero at any point during a 15-minute window at 70% of projected peak load, double the Messaging Unit count before the workload goes to production.
For Event Hubs Standard tier namespaces, enable the AutoInflate feature with a maximum Throughput Unit ceiling to allow the namespace to scale automatically during unexpected load spikes. For Premium and Dedicated tiers, AutoInflate is not available, so the scaling headroom must be provisioned ahead of the peak load.
ThrottledRequests exceeds zero for more than 5 minutes. This is an early warning of approaching saturation that warrants a scaling event. Pair this with a monthly cost review: if ThrottledRequests has been zero for three consecutive months, the namespace is over-provisioned and a downgrade review is warranted.
Lab
CE-21: Deploy End-to-End Distributed Tracing for APIM and Logic Apps
Configure end-to-end distributed tracing across APIM, Logic Apps, and Service Bus using Application Insights correlation IDs. This lab provisions the complete observability stack for a sample order-processing integration workflow.
#!/usr/bin/env bash
# CE-21: Configure end-to-end distributed tracing across APIM, Logic Apps,
# and Service Bus using Application Insights correlation IDs.

set -euo pipefail

RESOURCE_GROUP="rg-monitoring-observability-cost-prod-001"
LOCATION="eastus2"
WORKSPACE_NAME="log-integration-prod-eastus2-001"
APPINSIGHTS_NAME="appi-monitoring-observability-prod-eastus2-001"
APIM_NAME="apim-integration-prod-eastus2-001"
LOGIC_APP_NAME="logic-order-processing-prod-eastus2-001"
SERVICEBUS_NAMESPACE="sb-integration-prod-eastus2-001"

echo "=== CE-21: Distributed Tracing Configuration ==="

# Step 1: Verify workspace-based Application Insights is configured
APPINSIGHTS_TYPE=$(az monitor app-insights component show \
  --app "$APPINSIGHTS_NAME" \
  --resource-group "$RESOURCE_GROUP" \
  --query ingestionMode --output tsv)

if [ "$APPINSIGHTS_TYPE" != "LogAnalytics" ]; then
  echo "ERROR: Application Insights is not workspace-based. Migrate first."
  exit 1
fi
echo "Application Insights is workspace-based (LogAnalytics ingestion mode)"

# Step 2: Configure APIM global policy to propagate W3C traceparent headers
APIM_SUBSCRIPTION_ID=$(az account show --query id --output tsv)

cat > /tmp/apim-global-correlation-policy.xml << 'POLICY_EOF'
<policies>
  <inbound>
    <base />
    <set-variable name="traceId" value="@(Guid.NewGuid().ToString("N"))" />
    <set-variable name="spanId" value="@(Guid.NewGuid().ToString("N").Substring(0, 16))" />
    <set-header name="traceparent" exists-action="skip">
      <value>@($"00-{context.Variables["traceId"]}-{context.Variables["spanId"]}-01")</value>
    </set-header>
    <set-header name="x-correlation-id" exists-action="skip">
      <value>@(context.Variables.GetValueOrDefault<string>("traceId"))</value>
    </set-header>
    <set-header name="x-ms-client-tracking-id" exists-action="skip">
      <value>@(context.Variables.GetValueOrDefault<string>("traceId"))</value>
    </set-header>
  </inbound>
  <backend><base /></backend>
  <outbound>
    <base />
    <set-header name="x-correlation-id" exists-action="override">
      <value>@(context.Variables.GetValueOrDefault<string>("traceId"))</value>
    </set-header>
  </outbound>
  <on-error><base /></on-error>
</policies>
POLICY_EOF

echo "APIM global correlation policy prepared at /tmp/apim-global-correlation-policy.xml"

# Step 3: Configure Logic Apps Standard to use Application Insights
APPINSIGHTS_CONNECTION_STRING=$(az monitor app-insights component show \
  --app "$APPINSIGHTS_NAME" \
  --resource-group "$RESOURCE_GROUP" \
  --query connectionString --output tsv)

az logicapp config appsettings set \
  --name "$LOGIC_APP_NAME" \
  --resource-group "$RESOURCE_GROUP" \
  --settings \
    "APPLICATIONINSIGHTS_CONNECTION_STRING=$APPINSIGHTS_CONNECTION_STRING" \
    "ApplicationInsightsAgent_EXTENSION_VERSION=~3"

echo "Logic Apps Application Insights integration configured"

# Step 4: Configure Service Bus diagnostic settings to stream to Log Analytics
WORKSPACE_RESOURCE_ID=$(az monitor log-analytics workspace show \
  --resource-group "$RESOURCE_GROUP" \
  --workspace-name "$WORKSPACE_NAME" \
  --query id --output tsv)

SB_RESOURCE_ID=$(az servicebus namespace show \
  --name "$SERVICEBUS_NAMESPACE" \
  --resource-group "$RESOURCE_GROUP" \
  --query id --output tsv)

az monitor diagnostic-settings create \
  --name "diag-sb-to-loganalytics-prod" \
  --resource "$SB_RESOURCE_ID" \
  --workspace "$WORKSPACE_RESOURCE_ID" \
  --logs '[
    {"category":"OperationalLogs","enabled":true,"retentionPolicy":{"enabled":false}},
    {"category":"VNetAndIPFilteringLogs","enabled":true,"retentionPolicy":{"enabled":false}}
  ]' \
  --metrics '[{"category":"AllMetrics","enabled":true,"retentionPolicy":{"enabled":false}}]'

echo "Service Bus diagnostic settings configured"

# Step 5: Validate correlation — send test request and query the trace
APIM_GATEWAY_URL=$(az apim show \
  --name "$APIM_NAME" \
  --resource-group "$RESOURCE_GROUP" \
  --query gatewayUrl --output tsv)

TEST_CORRELATION_ID="test-ce21-$(date +%s)"

HTTP_RESPONSE=$(curl -s -o /dev/null -w "%{http_code}" \
  -H "x-correlation-id: $TEST_CORRELATION_ID" \
  -H "Content-Type: application/json" \
  -d '{"orderId":"ORD-TEST-001","amount":99.99}' \
  "${APIM_GATEWAY_URL}/orders" 2>/dev/null || echo "000")

echo "Test request sent — correlation ID: $TEST_CORRELATION_ID | HTTP: $HTTP_RESPONSE"
echo ""
echo "Verification query (run in Log Analytics after 5-min ingestion delay):"
echo "union requests, dependencies, traces"
echo "| where timestamp > ago(10m)"
echo "  and (operation_Id contains \"$TEST_CORRELATION_ID\""
echo "       or customDimensions[\"x-correlation-id\"] == \"$TEST_CORRELATION_ID\")"
echo "| project timestamp, cloud_RoleName, itemType, name, resultCode, duration, operation_Id"
echo "| order by timestamp asc"

echo ""
echo "=== CE-21 Complete ==="CE-22: Build Cost Allocation Tag Policy and Cost Management Views
Deploy Azure Policy for integration cost allocation tag enforcement and configure Azure Cost Management views for integration workload analysis. Covers tag inheritance policy, custom cost views, and budget alerts.
#!/usr/bin/env bash
# CE-22: Deploy Azure Policy for integration cost allocation tag enforcement
# and configure Azure Cost Management views for integration workload analysis.

set -euo pipefail

RESOURCE_GROUP="rg-monitoring-observability-cost-prod-001"
SUBSCRIPTION_ID=$(az account show --query id --output tsv)
LOCATION="eastus2"

echo "=== CE-22: Cost Allocation Tagging and Cost Management ==="

# Step 1: Assign tag enforcement policies for each required tag
REQUIRED_TAGS=("environment" "workload" "integrationDomain" "costCenter" "owner" "dataClassification")

echo "Step 1: Assigning tag enforcement policies..."
for TAG in "${REQUIRED_TAGS[@]}"; do
  az policy assignment create \
    --name "require-tag-${TAG}-integration" \
    --display-name "Integration: Require tag '${TAG}' on resources" \
    --policy "/providers/Microsoft.Authorization/policyDefinitions/871b6d14-10aa-478d-b590-94f262ecfa99" \
    --scope "/subscriptions/${SUBSCRIPTION_ID}/resourceGroups/${RESOURCE_GROUP}" \
    --params "{\"tagName\":{\"value\":\"${TAG}\"}}" \
    --enforcement-mode Default 2>/dev/null || \
    echo "  Policy for ${TAG} already exists or requires elevated permissions"
done

# Step 2: Assign tag inheritance policy (inherit from resource group if missing)
INHERIT_POLICY_ID="/providers/Microsoft.Authorization/policyDefinitions/ea3f2387-9b95-492a-a190-fcdc54f7b070"
for TAG in "${REQUIRED_TAGS[@]}"; do
  az policy assignment create \
    --name "inherit-tag-${TAG}-from-rg" \
    --display-name "Integration: Inherit '${TAG}' from resource group if missing" \
    --policy "$INHERIT_POLICY_ID" \
    --scope "/subscriptions/${SUBSCRIPTION_ID}/resourceGroups/${RESOURCE_GROUP}" \
    --params "{\"tagName\":{\"value\":\"${TAG}\"}}" \
    --enforcement-mode Default 2>/dev/null || \
    echo "  Inheritance policy for ${TAG} already exists"
done
echo "Tag inheritance policies configured"

# Step 3: Apply baseline tags to existing resources
BASELINE_TAGS=(
  "environment=production"
  "workload=integration-platform"
  "integrationDomain=platform"
  "costCenter=CC-PLATFORM-001"
  "owner=integration-platform@contoso.com"
  "dataClassification=internal"
)

az resource list \
  --resource-group "$RESOURCE_GROUP" \
  --query "[].id" --output tsv | while read RESOURCE_ID; do
    az resource tag \
      --ids "$RESOURCE_ID" \
      --tags "${BASELINE_TAGS[@]}" \
      --is-incremental 2>/dev/null || true
  done
echo "Baseline tags applied to existing resources"

# Step 4: Create Azure Cost Management budget with alert thresholds
BUDGET_START_DATE=$(date +%Y-%m-01)
ALERT_EMAIL="integration-platform@contoso.com"

az consumption budget create \
  --budget-name "budget-integration-platform-prod-monthly" \
  --amount 15000 \
  --time-grain Monthly \
  --start-date "$BUDGET_START_DATE" \
  --end-date "2027-12-31" \
  --resource-group "$RESOURCE_GROUP" \
  --notifications '[
    {"enabled":true,"operator":"GreaterThan","threshold":80,
     "contactEmails":["'"$ALERT_EMAIL"'"],"thresholdType":"Actual","locale":"en-us"},
    {"enabled":true,"operator":"GreaterThan","threshold":100,
     "contactEmails":["'"$ALERT_EMAIL"'"],"thresholdType":"Actual","locale":"en-us"},
    {"enabled":true,"operator":"GreaterThan","threshold":110,
     "contactEmails":["'"$ALERT_EMAIL"'"],"thresholdType":"Forecasted","locale":"en-us"}
  ]' 2>/dev/null || echo "Budget creation requires BillingAccountReader role"

echo "Monthly budget of \$15,000 configured with alerts at 80%, 100% actual and 110% forecasted"

# Step 5: Create cost export for integration domain analysis
STORAGE_ACCOUNT="stcostexportprodeastus2001"
STORAGE_CONTAINER="cost-exports"

az storage account create \
  --name "$STORAGE_ACCOUNT" \
  --resource-group "$RESOURCE_GROUP" \
  --location "$LOCATION" \
  --sku Standard_LRS \
  --kind StorageV2 \
  --tags \
    environment=production \
    workload=cost-management \
    integrationDomain=platform \
    costCenter=CC-PLATFORM-001 \
    owner=integration-platform@contoso.com \
    dataClassification=internal

az storage container create \
  --name "$STORAGE_CONTAINER" \
  --account-name "$STORAGE_ACCOUNT" \
  --auth-mode login

az costmanagement export create \
  --name "export-integration-domain-daily" \
  --scope "/subscriptions/${SUBSCRIPTION_ID}/resourceGroups/${RESOURCE_GROUP}" \
  --type ActualCost \
  --storage-account-id "$(az storage account show \
    --name $STORAGE_ACCOUNT \
    --resource-group $RESOURCE_GROUP \
    --query id --output tsv)" \
  --storage-container "$STORAGE_CONTAINER" \
  --timeframe MonthToDate \
  --recurrence Daily \
  --recurrence-period "from=$(date +%Y-%m-01T00:00:00Z) to=2027-12-31T00:00:00Z" \
  2>/dev/null || echo "Cost export creation may require Cost Management Contributor role"

echo ""
echo "=== CE-22 Complete: Cost allocation tagging and Cost Management configured ==="
echo "Next steps:"
echo "  1. Review tag compliance in Azure Policy Compliance portal"
echo "  2. Configure Cost Management custom views grouped by 'integrationDomain' tag"
echo "  3. Set up weekly cost report email to integration domain owners"
echo "  4. Review monthly budget spend against the \$15,000 allocation"
Summary
| Concept | Key Point |
|---|---|
| Observability Triad | Metrics, logs, and traces each answer different diagnostic questions; all three must be present for production integration observability. Build on a single workspace-based Application Insights resource per region. |
| Distributed Tracing | Correlation depends on operation_Id (W3C traceparent) flowing unmodified from APIM through Logic Apps to Service Bus and Event Hubs. Use APIM set-header policies to defensively re-inject traceparent on all outbound requests. |
| Workbook Design | Use a three-tier workbook pattern: executive health score, per-service throughput and error rates, and transaction-level correlation drilldown. Include seasonality-aware baseline comparison queries to distinguish genuine anomalies from business-hours variation. |
| Alert Taxonomy | Categorize alerts into four severities with suppression windows to prevent flapping. Use dynamic thresholds for latency and throughput alerts on services with diurnal patterns; use static thresholds for absolute limits like DLQ depth and consumer lag. |
| DLQ and Consumer Lag | Dead-letter queue depth growth is the definitive signal of message processing failure. Event Hubs consumer lag approaching retention expiry is the only integration failure with a hard non-recovery path. Alert on both absolute depth and sustained growth rate. |
| Cost Tagging | Seven mandatory tags (environment, workload, integrationDomain, costCenter, owner, dataClassification, and environment-specific expiryDate) enforced via Azure Policy deny effect enable domain-level cost attribution and automated non-production cleanup. |
| Right-Sizing | Benchmark Service Bus and Event Hubs across three dimensions: throughput, latency, and recovery time. Use ThrottledRequests as the primary saturation indicator. Scale up when it exceeds zero at 70% of projected peak load; review for downgrade when it has been zero for three consecutive months. |
Complete
All 11 chapters finished — from integration architecture fundamentals through monitoring, observability, and cost governance.