Power BI Data Analyst PL-300
PL-300 Exam Framework and Power BI Architecture
The PL-300 certification validates your ability to design, build, and govern data models that transform raw enterprise data into actionable business intelligence. This chapter establishes the architectural foundation: the four scored skill domains, the full Power BI product family, the end-to-end data flow from source to consumer, and the licensing tiers that govern production deployments.
The PL-300 Certification Landscape
What the Exam Measures
The PL-300 exam is Microsoft's assessment for the Data Analyst Associate role. It consists of 40–60 questions in approximately 100 minutes, with a passing score of 700 out of 1000. Question types include multiple-choice, drag-and-drop, case studies, and lab simulations — lab simulations are scored separately after the session ends.
Microsoft updates the skill outline periodically. The version current as of mid-2026 distributes scoring weight across four domains. Because domains are weighted — not equally scored — your study time allocation should mirror those weights rather than treating every topic equally.
The Four Scored Skill Domains and Their Weights
| Domain | Approx. Weight | Core Activities |
|---|---|---|
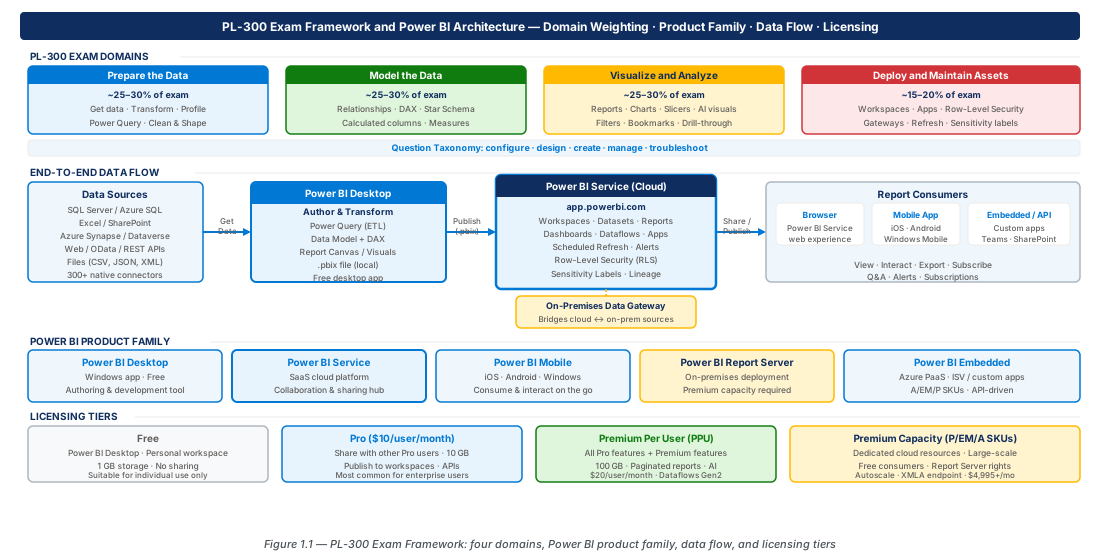
| Prepare the Data | 25–30% | Connect to sources, transform with Power Query, profile and clean datasets |
| Model the Data | 25–30% | Design star schemas, write DAX measures, manage relationships, optimize performance |
| Visualize and Analyze | 25–30% | Build reports, configure visuals, implement RLS, apply AI visuals |
| Deploy and Maintain Assets | 15–20% | Publish to workspaces, manage datasets, configure gateways, set refresh schedules |
Important
Candidates who over-invest in DAX at the expense of Power Query or governance frequently miss the passing threshold by a narrow margin in the deployment domain. Study proportionally.
Exam Question Taxonomy and Verb Analysis
Microsoft uses a controlled vocabulary of action verbs that signal the cognitive level required. Configure = set a property; Design = choose an architecture from alternatives; Create = produce an artifact (measure, workspace, report); Manage = administer an ongoing state; Troubleshoot = diagnose a symptom and identify the root cause or corrective action.
Tip
Underline the action verb before reading the rest of the question stem. The verb tells you the answer format and eliminates distractors that are technically accurate but answer the wrong question.
The Power BI Product Family
Power BI Desktop
Power BI Desktop is a free Windows application and the primary authoring environment for data models and reports. It exposes three integrated views: Report (visual authoring), Data (table inspection), and Model (relationship and property management). Publishing a .pbix to the Service creates two separate items — a dataset and a report — that can be managed independently.
Note
Desktop updates monthly. Check the skill outline publication date against Desktop release history if you encounter unfamiliar UI on exam day.
Power BI Service
The Power BI Service (app.powerbi.com) is the Azure-hosted SaaS platform providing dataset hosting, report sharing, dashboard aggregation, scheduled refresh, and the full governance experience via the Admin Portal. Content is organized into workspaces with four roles: Admin, Member, Contributor, and Viewer.
Important
Content in Premium Capacity workspaces can be consumed by Free-licensed users. Content in Pro-licensed workspaces requires Pro or PPU licenses for both creator and consumer.
Power BI Mobile
Power BI Mobile (iOS, Android, Windows) provides read-optimized access to Service-hosted content. The mobile layout editor in Desktop creates a phone-sized, single-column overlay without a separate data model — one .pbix delivers both desktop and mobile experiences from the same dataset.
Power BI Report Server
Power BI Report Server (PBIRS) is an on-premises hosting platform for .pbix, paginated .rdl, and Excel workbooks. It is licensed through Power BI Premium or SQL Server Enterprise with Software Assurance. PBIRS does not support dataflows, streaming datasets, or AI visuals, and uses a Desktop version pinned to the PBIRS release cycle.
Warning
Do not confuse PBIRS with SQL Server Reporting Services (SSRS). SSRS does not support .pbix files. Exam scenarios about on-premises Power BI report hosting require PBIRS.
Power BI Embedded
Power BI Embedded (Azure resource type Microsoft.PowerBIDedicated/capacities) allows ISVs to embed reports in custom applications without end-user Power BI licenses. It uses A-SKUs billed through Azure, and row-level security is enforced at embed time by passing role claims in the embed token via the Power BI JavaScript SDK.
End-to-End Data Flow: From Source to Consumer
Phase 1 — Data Ingestion and Connection
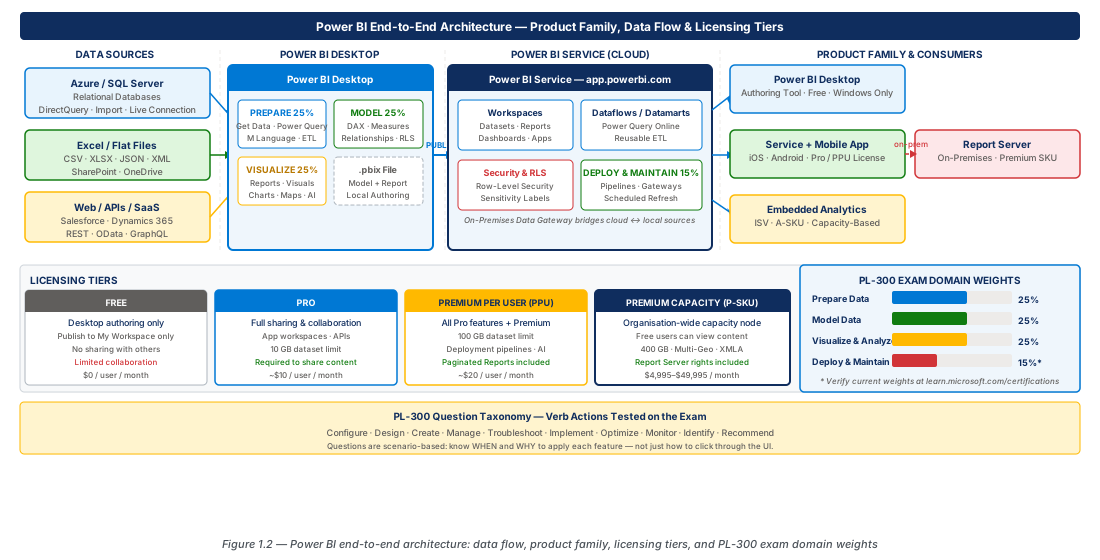
Every Power BI solution begins with connectivity via Get Data, which exposes over 150 certified connectors across File, Database, Power Platform, Azure, Online Services, and Other categories. The connectivity mode selected here has permanent consequences for performance and refresh. Import copies data into VertiPaq for fastest queries; DirectQuery sends each interaction as a live query; Composite allows per-table mixing.
Tip
Clues for Import: "source is slow," "data does not change frequently." Clues for DirectQuery: "data must be real-time," "dataset exceeds size limits." Clues for Composite: "dimension tables are small and static, fact tables are large and live."
Phase 2 — Transformation and Data Preparation
Power Query (M language) records every UI action as an Applied Step, making transforms reproducible and auditable. Key exam concepts: recognizing common M patterns (Table.SelectRows, Table.TransformColumnTypes, Table.AddColumn), and troubleshooting type-mismatch and null-propagation errors.
Query folding translates Power Query steps into native source queries (SQL, OData, etc.), executing data reduction at the source. Steps that break folding are signaled by a grayed-out "View Native Query" option. Always place filters and column removals immediately after the source step to maximize folding.
Important
Place row-reduction and column-removal steps at the top of Applied Steps to maximize query folding. Steps that reduce data volume are most beneficial when they execute at the source.
Phase 3 — Semantic Modeling
Relationships are directional (one-to-many default, Single cross-filter direction). Bi-directional filtering is necessary for some many-to-many patterns but can produce incorrect totals if misapplied. DAX measures use row context and filter context; CALCULATE performs context transition. Key functions: RELATED, RELATEDTABLE, iterator functions (SUMX, AVERAGEX), time intelligence (TOTALYTD, DATEADD), and security functions (USERPRINCIPALNAME).
Phase 4 — Visualization and Report Design
Reports are collections of pages with visuals whose field wells bind to the semantic model. The interaction model — cross-highlighting, cross-filtering, drill-through, tooltip pages — is configured in Format pane and Edit Interactions mode. Visual types range from standard charts to AI visuals (Decomposition Tree, Key Influencers, Q&A, Smart Narrative) and AppSource custom visuals.
Phase 5 — Publishing, Governance, and Consumption
Publishing a .pbix creates a dataset and report as separate Service items. Multiple reports can connect to a single shared dataset using "Connect to a published dataset." Workspace roles (Admin, Member, Contributor, Viewer) are additive with dataset-level permissions (Build, Read). Workspace Admins, Members, and Contributors are never subject to RLS — they see all data.
Licensing Tiers: Free, Pro, Premium Per User, and Premium Capacity
The Licensing Model and Its Architectural Implications
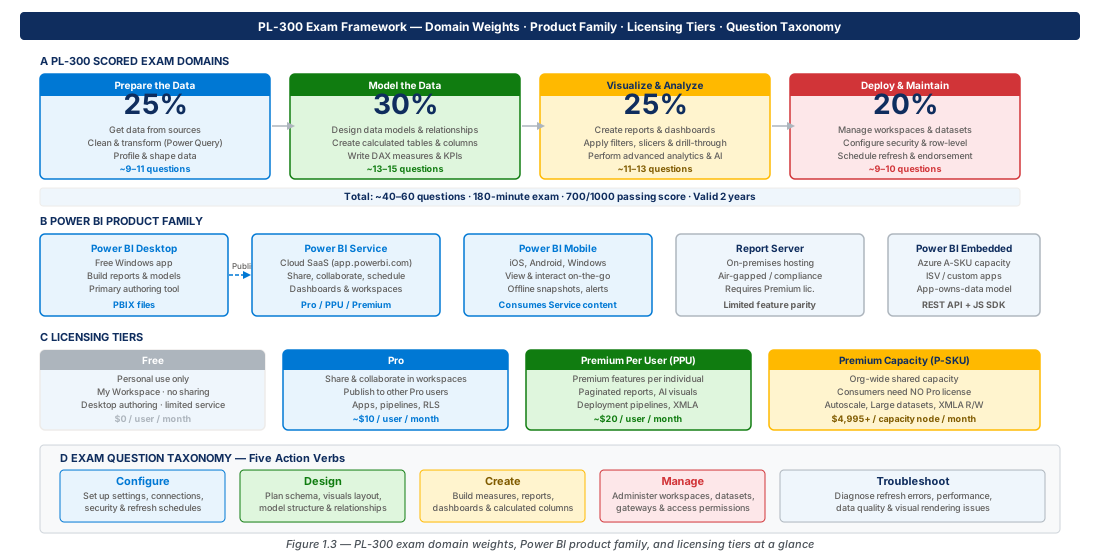
Power BI licensing operates on two dimensions: per-user licenses (attached to an Entra ID identity) and capacity licenses (attached to a workspace with dedicated Azure compute). Getting licensing wrong creates both a governance failure and a capability failure in production.
Important
Content in a Premium Capacity workspace can be consumed by Free-licensed users. If the workspace is not Premium Capacity, the consumer needs Pro or PPU. This distinction appears in multiple exam question forms.
Licensing Tier Comparison
| Feature | Free | Pro | Premium Per User | Premium Capacity |
|---|---|---|---|---|
| Publish to org workspace | No | Yes | Yes | Yes |
| Share reports with others | No | Yes | Yes | Yes |
| Free consumers can access | — | No | No | Yes |
| Scheduled refresh / day | No | 8 | 48 | 48 |
| Max dataset size | 1 GB | 1 GB | 100 GB | 400 GB (P5) |
| Paginated reports | No | No | Yes | Yes |
| XMLA endpoint | No | No | Read | Read/Write |
| Deployment pipelines | No | No | Yes | Yes |
| AI visuals (AutoML, Cognitive) | No | No | Yes | Yes |
Premium Capacity SKUs
| SKU | v-Cores | Max Model Size | Use Case |
|---|---|---|---|
| P1 / EM3 / A4 | 8 | 25 GB | Departmental Premium, medium models |
| P2 / EM4 / A5 | 16 | 50 GB | Organizational Premium, large models |
| P3 / EM5 / A6 | 32 | 100 GB | Enterprise Premium, very large models |
| F2–F64 (Fabric) | 2–64 | Varies | Microsoft Fabric capacity — strategic successor to P-SKUs |
Note
F-SKUs (Microsoft Fabric) are the strategic successor to P-SKUs for new capacity purchases. Both P-SKU and F-SKU knowledge may be tested on the PL-300 exam as of 2026.
Lab
CE-01: Provision Resource Groups for Power BI Governance Baseline
Create CAF-compliant production and development resource groups with governance tags. Apply a policy to enforce tag inheritance on Power BI resources.
az account set --subscription "exam-framework-sub-001"
az group create \
  --name "rg-exam-framework-architecture-prod-001" \
  --location "eastus2" \
  --tags "Environment=Production" "WorkloadName=PowerBI-Architecture"
# Repeat for dev resource group with Environment=Development tagCE-02: Deploy a Fabric F2 Capacity Node in Azure
Register the Microsoft.PowerBIDedicated resource provider and deploy an F2 Fabric capacity to the production resource group. The F2 SKU is the minimum Fabric capacity for dev/test scenarios.
az provider register --namespace "Microsoft.PowerBIDedicated" --wait
az resource create \
  --resource-group "rg-exam-framework-architecture-prod-001" \
  --resource-type "Microsoft.PowerBIDedicated/capacities" \
  --name "exam-framework-prod-eastus2-001" \
  --location "eastus2" \
--properties '{"sku":{"name":"F2","tier":"Fabric"},"administration":{"members":["chakravarthy_b@infosys.com"]}}'CE-03: Enable Diagnostic Logging for the Fabric Capacity
Create a Log Analytics workspace and configure diagnostic settings to stream Engine, Service, and AllMetrics telemetry. This supports the operational governance pattern tested in the Deploy domain.
az monitor log-analytics workspace create \
  --resource-group "rg-exam-framework-architecture-prod-001" \
  --workspace-name "law-exam-framework-prod-001" \
  --location "eastus2" --sku "PerGB2018" --retention-time 90
# Retrieve IDs then run az monitor diagnostic-settings create
# forwarding Engine, Service, and AllMetrics categories (90-day retention)
Summary
| Concept | Key Point |
|---|---|
| PL-300 Domain Weights | Prepare (25–30%), Model (25–30%), Visualize (25–30%), Deploy (15–20%); study proportionally |
| Power BI Desktop | Free Windows authoring tool; publishes .pbix creating a separate dataset and report in the Service |
| Connectivity Modes | Import (fastest, size limits), DirectQuery (always current, source-dependent), Composite (hybrid) |
| Licensing Tiers | Free: My Workspace only; Pro: org sharing (both parties need Pro); PPU: Premium features per-user (all consumers need PPU); Premium Capacity: Free consumers can access |
| RLS | Static: fixed DAX filters; Dynamic: USERPRINCIPALNAME(); workspace Admins/Members/Contributors bypass RLS |
| Exam Verb Taxonomy | Configure = property; Design = architecture; Create = artifact; Manage = ongoing state; Troubleshoot = diagnose symptom |
Chapter: 1 of 12 | Status: v0.1 Draft |