Power BI Data Analyst PL-300
Performance Optimization, Monitoring, and Governance at Scale
Enterprise Power BI deployments live or die by their operational maturity: a beautifully modeled dataset that takes forty seconds to render a slicer change will be abandoned, and a tenant with no audit trail becomes a compliance liability the moment regulators arrive. This final chapter treats performance optimization, usage monitoring, and governance as first-class architectural disciplines that every PL-300 certified analyst must own end-to-end.
Foundations: The Power BI Performance and Governance Stack
Understanding Where Time Goes in a Power BI Query
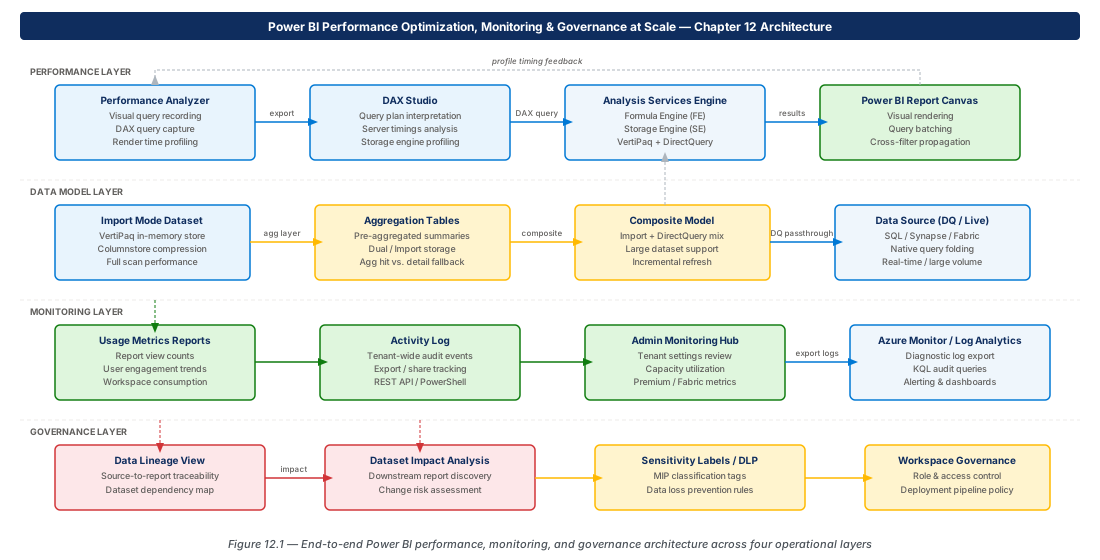
Every visual refresh executes a three-phase pipeline: the DAX query phase (Analysis Services formula engine), the storage engine phase (Vertipaq for Import or the DirectQuery connector), and the rendering phase (JavaScript paint). Import-mode datasets spend most time in the formula engine processing complex iterators; DirectQuery datasets spend nearly all time waiting on the upstream source. Composite models can exhibit both pathologies simultaneously, requiring independent diagnosis per storage island.
Optimization strategy must follow the architecture. Tuning a SUMX expression has zero effect on a DirectQuery table; rewriting a SQL view has zero effect on an Import-mode calculation. Knowing which engine owns a given query segment is the foundational skill — and it is what Performance Analyzer and DAX Studio were built to surface.
Note
The Vertipaq storage engine is multi-threaded and benefits from high core counts at Premium or Fabric capacity. The formula engine is single-threaded — complex nested iterators saturate a single core regardless of SKU.
The Governance Imperative in Enterprise Tenants
Governance means three concurrent disciplines: audit (who accesses what), lineage (where data comes from), and impact analysis (how upstream changes affect downstream consumers). The Power BI Activity Log provides the raw event stream; the Microsoft 365 Unified Audit Log aggregates it alongside Teams and SharePoint for cross-service correlation; Azure Monitor Log Analytics adds long-term retention and KQL querying.
Important
Activity Log events are retained for only 30 days in the Power BI service. SOC 2 Type II, ISO 27001, HIPAA, and most financial regulations require 90 days to 7 years. Export to Log Analytics or Azure Storage must be a foundational tenant setup task.
Performance Analyzer and DAX Studio: Diagnosing Slow Reports
Using Performance Analyzer in Power BI Desktop
Performance Analyzer (View ribbon → Start recording) captures per-visual timing broken into three categories: DAX query time (formula engine duration), Other time (rendering and conditional formatting), and Direct query time (round-trip to the data source, shown only for DirectQuery visuals). Always clear the visual cache before measuring — a warm cache produces artificially low DAX times.
Use the Copy query button next to any high-duration entry to extract the exact DAX expression with its full slicer filter context, then paste it directly into DAX Studio for deep analysis. Sort results by DAX query time descending: in most problematic reports, 20% of visuals account for 80% of total query time.
Tip
Sort Performance Analyzer results by DAX query time descending and fix the top two or three offenders before touching anything else — Pareto applies here.
DAX Studio: Query Plans and Server Timings
DAX Studio connects directly to the Analysis Services engine inside Power BI Desktop or a published Premium/Fabric dataset. With Server Timings enabled, the results pane shows four key metrics: Total (wall-clock duration), SE CPU (cumulative storage engine CPU across all sub-queries), FE (formula engine processing time), and the FE/Total ratio — the primary diagnostic signal. A healthy Import-mode query is SE-heavy; an FE-heavy query indicates expensive row-by-row iteration.
The Query Plan tab exposes the physical plan tree. Nodes labeled Spool — especially CallbackDataID spools — are the most expensive pattern in Vertipaq, indicating the formula engine called back into the storage engine row by row due to a complex filter that cannot be expressed as a simple column equality.
Warning
Do not run VertiPaq Analyzer scans against a shared Premium capacity (P1–P3 or F SKUs without isolation) during business hours — these diagnostic queries consume significant memory and CPU, degrading performance for all users on that node.
Practical DAX Optimization Patterns
Three high-impact patterns cover most slow-query scenarios. First, replace iterator functions with aggregation functions where semantically equivalent: SUMX(Sales, Sales[Qty] * Sales[Price]) iterates in the formula engine; SUM(Sales[ExtendedAmount]) delegates entirely to the storage engine and is typically 10–50x faster. Second, reduce filter context complexity — replace FILTER(ALL(Table), complex_expression) with KEEPFILTERS or simple column equalities so the storage engine applies filters as bitmap masks. Third, use VAR/RETURN to eliminate repeated expression evaluation: variables are computed once and cached for the measure's lifetime.
Aggregation Tables and Composite Model Design for Large Datasets
The Aggregation Architecture Concept
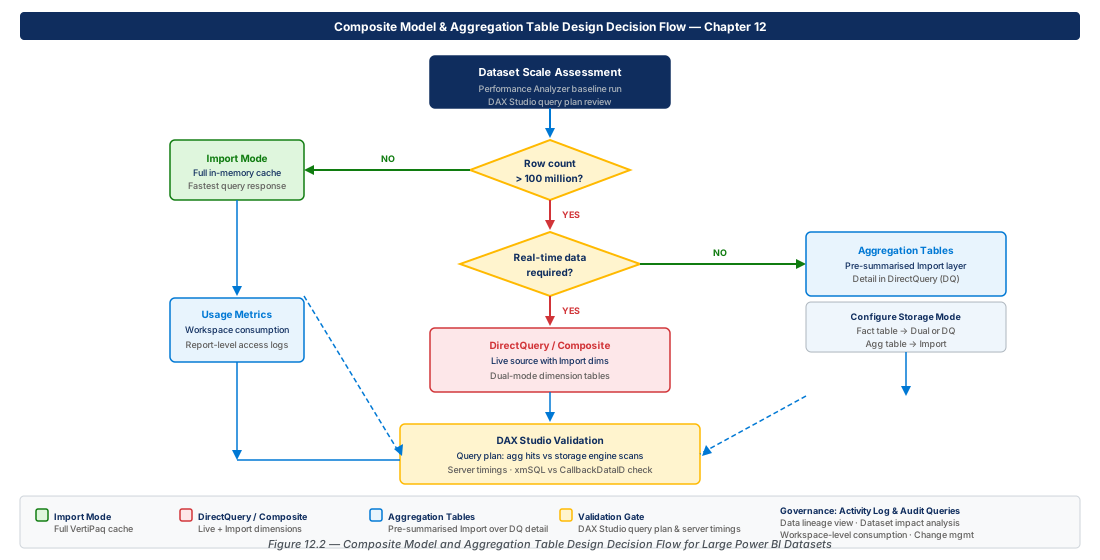
Aggregation tables are pre-materialized Import-mode summaries of fact tables that Power BI's query engine satisfies automatically, with transparent DirectQuery fallback for detail-grain filters. A P1 capacity holds 25 GB of memory — aggregations let you keep a small Import-mode summary for common high-level queries while retaining DirectQuery for drill-through. Aggregation hit rates of 90% or higher are achievable in well-designed models.
Note
Aggregation tables require Power BI Premium (per capacity or per user) or Microsoft Fabric — they are not available in Power BI Pro. This licensing boundary is explicitly tested on the PL-300 exam.
Designing and Configuring Aggregation Tables
Creating an aggregation table requires four steps: (1) build the summary table in your warehouse or dataflow at the target granularity; (2) import it into the dataset in Import storage mode; (3) create relationships to the same dimension tables used by the detail fact; (4) configure mappings in Manage aggregations — specifying summarization type (Sum, Count, Min, Max) per measure column and group-by mappings per dimension key.
The Precedence setting controls priority when multiple aggregation tables exist. A common pattern: coarse-grained aggregation (yearly, product category) at high precedence, fine-grained (monthly, subcategory) at lower precedence. The engine checks coarser tables first and falls through only when the filter context requires finer granularity.
Important
The aggregation table's group-by columns must exactly match the granularity of its dimension relationships. If the Date dimension relates to the fact at day grain but the aggregation is at month grain, expose a MonthKey column on the Date dimension and relate to that — not to DayKey. Misaligned granularity causes all queries to fall through to DirectQuery.
Composite Model Design Principles
Composite models mix storage modes across multiple data sources. The key constraint: cross-island joins are forbidden at the query layer — Power BI materializes the Import-mode side in memory and passes it as a filter to the DirectQuery engine. The recommended enterprise architecture: all dimension tables in Import mode (small, infrequently changing), detail fact tables in DirectQuery, aggregation fact tables in Import mode.
Aggregation Table Decision Framework
| Scenario | Storage Mode | Aggregation? | Notes |
|---|---|---|---|
| Dataset < 1 GB, interactive refresh | Import only | No | Vertipaq handles natively |
| Dataset 1–10 GB, daily refresh | Import | No | Optimize DAX and model first |
| Dataset 10–100 GB, mixed granularity | Composite: Import agg + DQ detail | Yes | Month/category agg covers 80%+ queries |
| Dataset > 100 GB, real-time | DirectQuery only | Yes (critical) | Without agg, query times unacceptable |
| Multiple source systems | Composite multi-source | Yes for large facts | Island boundaries require careful planning |
| Streaming / near-real-time | Push dataset or hybrid tables | N/A | Aggregations not applicable to streaming partition |
Usage Metrics Reports and Workspace-Level Consumption Analysis
Built-In Usage Metrics in the Power BI Service
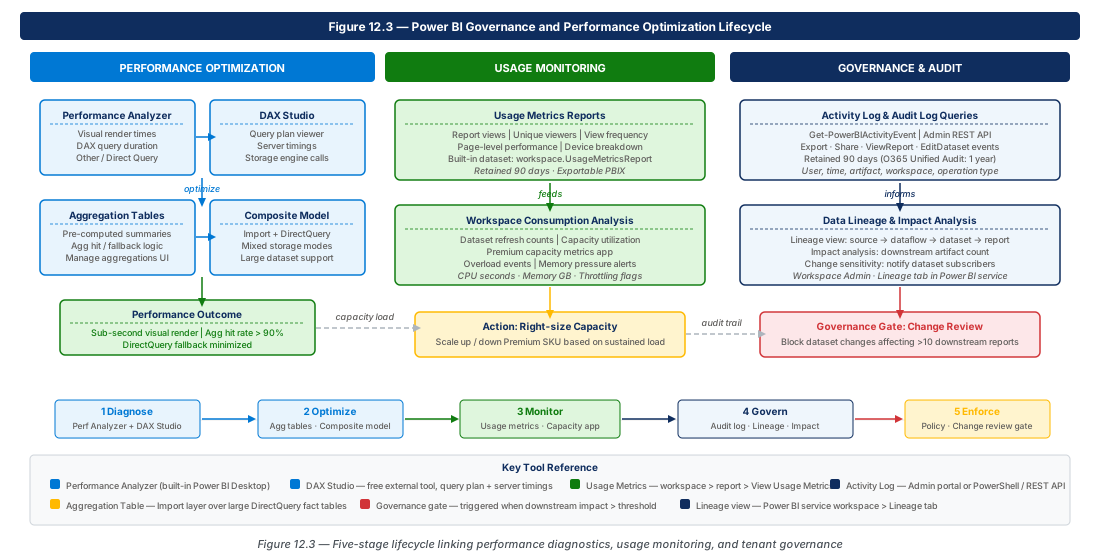
Built-in usage metrics reports (ellipsis menu → View usage metrics report) track unique viewers, view counts, sharing activity, and performance over a rolling 90-day window. They are adequate for individual content item popularity but cannot be aggregated across workspaces or correlated with organizational data. The Admin portal setting Export usage metrics data to workspace datasets must be enabled before any serious tenant-wide analytics program is possible.
When enabled and an Admin monitoring workspace is created, Power BI materializes two datasets — Feature Usage and Adoption and Purview Hub — covering daily active users, refresh success rates, and capacity utilization by hour across the entire tenant. These identify stale content (not opened in 60+ days) and datasets consuming disproportionate capacity resources.
Building Custom Consumption Analytics with the REST API
The Get-PowerBIActivityEvent PowerShell cmdlet wraps the Activity Log REST API and returns events in 1-hour windows. Because the API does not support pagination across windows, a production pipeline loops through 24 hourly windows per day. A more robust implementation stores the last successfully exported timestamp in Azure Blob Storage to handle failures without gaps.
# Retrieve one hour of activity events
Get-PowerBIActivityEvent `
  -StartDateTime "2026-07-20T09:00:00.000Z" `
  -EndDateTime   "2026-07-20T10:00:00.000Z" `
| ConvertFrom-JsonNote
The Activity Log API requires a Power BI Service Administrator or Global Administrator. Service principal authentication is recommended for automated pipelines to avoid embedding individual user credentials in orchestration tools.
Capacity Utilization and Premium SKU Selection
The Microsoft Fabric Capacity Metrics app (AppSource template app) reports CPU utilization, memory pressure, query concurrency, and refresh scheduling. Power BI Premium uses a smoothing algorithm: if the smoothed 24-hour CPU average consistently exceeds 100%, the capacity is overloaded and users will experience throttling. The correct response is optimizing the most CPU-intensive datasets (identified by the "by artifact" breakdown) or upgrading the SKU.
| SKU | vCores | Memory (GB) | Max Dataset (GB) | Concurrent Refreshes |
|---|---|---|---|---|
| P1 / F64 | 8 | 25 | 25 | 8 |
| P2 / F128 | 16 | 50 | 50 | 16 |
| P3 / F256 | 32 | 100 | 100 | 32 |
| P4 / F512 | 64 | 200 | 400 | 64 |
| PPU (per user) | Shared | 100 GB pool | 100 | N/A |
Activity Log and Audit Log Queries for Tenant Governance
The Activity Log Architecture
The Power BI Activity Log captures 100+ distinct activity types — artifact operations (CreateReport, ExportArtifact), data operations (RefreshDataset), sharing operations (ShareReport), and administrative operations (UpdatedAdminFeatureSwitch). Each event is a JSON object with a consistent schema including ActivityId, Activity, UserId, WorkspaceName, ArtifactId, CapacityId, CreationTime, and a variable Details field.
The Microsoft 365 Unified Audit Log (UAL) is the superset, also capturing Teams, SharePoint, and Azure AD sign-in events. The UAL retains events for 90 days by default, extendable to 1 or 10 years with Microsoft Purview Audit (Premium) licensing. Long-term compliance programs must route events to Log Analytics or Azure Storage.
Writing Audit Queries in KQL
Once Activity Log events land in Azure Monitor Log Analytics, the PowerBIActivity table becomes the primary target. The following queries cover the two most common governance scenarios: data export detection and stale dataset identification.
// Users who exported data in the past 7 days
PowerBIActivity
| where TimeGenerated >= ago(7d)
| where Activity == "ExportArtifact"
| extend ExportType = tostring(parse_json(Details).ExportedArtifactType)
| summarize ExportCount = count() by UserId, WorkspaceName, ExportType
| order by ExportCount desc// Datasets not refreshed in the past 14 days
PowerBIActivity
| where TimeGenerated >= ago(14d)
| where Activity == "RefreshDataset"
| summarize LastRefresh = max(TimeGenerated) by ArtifactId, ArtifactName, WorkspaceName
| where LastRefresh < ago(14d)
| order by LastRefresh ascTip
Create Azure Monitor Alert rules on KQL queries that detect high-severity events — mass data exports, deletion of certified datasets, or admin permission changes outside business hours. These alerts can trigger Logic App workflows notifying the security team via Teams within minutes.
Data Lineage View and Dataset Impact Analysis for Change Management
Navigating the Lineage View in Power BI Service
The Lineage view (workspace toolbar → Lineage icon) renders an interactive directed acyclic graph where nodes represent data sources, dataflows, datasets, reports, and dashboards, flowing left-to-right in the natural direction of data movement. Clicking any node highlights all upstream and downstream dependencies. Hovering a relationship edge shows the dependency type: Live connection means the report will be immediately affected by a schema change; Import means the report holds its own data copy and will not reflect changes until refreshed and republished.
Note
The built-in Lineage view is workspace-scoped, not tenant-scoped. Cross-workspace lineage requires the Microsoft Purview integration or the API-based lineage scanning feature in Fabric — a common PL-300 exam misconception.
Impact Analysis: Managing Schema Changes Safely
Impact analysis (View impact on any dataset) lists every dependent report, dashboard, and dataset, along with owner contact information and the recent unique viewer count. A change affecting five reports with zero viewers in 30 days has a very different risk profile than a change affecting two reports with 500 daily active users. Best practice: export the impact list, contact high-traffic report owners, coordinate a freeze window, then deploy.
The Power BI REST API's Get Dataset Dependents endpoint (GET /v1.0/myorg/datasets/{datasetId}/dependents) enables automated governance gates: a deployment pipeline can call this endpoint and block the release if any downstream high-traffic reports exceed a configured threshold.
Important
Renaming a column in a Power BI dataset does not automatically update reports with DirectQuery live connections — those reports will show "Field not found" errors. Impact analysis identifies who is affected; coordinated manual remediation is still required.
Documenting Lineage for Regulatory Compliance
BCBS 239, HIPAA, and GDPR Article 30 require lineage documentation that is current, comprehensive, and verifiable. The visual Lineage view is insufficient as a compliance artifact — it is not exportable to a static format and is not versioned. The Power BI Admin REST API (Get Workspaces as Admin, Get Datasource Instances) provides workspace metadata that can be assembled into a versioned lineage graph, snapshotted daily, committed to Azure DevOps, and provided to auditors as evidence.
Lab
CE-23: Diagnose and Optimize with DAX Studio and Aggregations
Provision an Azure SQL Database with AdventureWorksLT sample data to serve as the DirectQuery source. Create the monthly-category sales aggregation table in SQL, then configure it in Power BI Desktop using Manage Aggregations.
# CE-23: Provision SQL Server and AdventureWorksDW database
SQL_SERVER="sql-pbiperf-prod-eastus2-001"
SQL_DB="sqldb-adventureworksdw-prod-001"
SQL_RG="rg-performance-monitoring-governance-prod-001"

az group create --name $SQL_RG --location eastus2
az sql server create --name $SQL_SERVER --resource-group $SQL_RG \
  --location eastus2 --admin-user pbiadmin --admin-password "PBIPerf@2026!"
az sql db create --resource-group $SQL_RG --server $SQL_SERVER \
  --name $SQL_DB --sample-name AdventureWorksLT --service-objective S3
# Next: Import agg table in Power BI Desktop, set detail tables to DirectQuery,
# right-click agg table > Manage Aggregations, map TotalSales > SUM > LineTotalCE-24: Build a Governance Monitoring Dashboard with Activity Log Analytics
Provision a Log Analytics workspace and Key Vault, configure an Action Group for security team alerts, and create a scheduled-query alert that fires when any user exports more than 10 Power BI artifacts within one hour.
# CE-24: Provision Log Analytics workspace for audit ingestion
LOG_RG="rg-performance-monitoring-governance-prod-001"
WORKSPACE="performance-monitoring-prod-eastus2-001"
KV="kv-pbigov-prod-eastus2-001"

az monitor log-analytics workspace create --resource-group $LOG_RG \
  --workspace-name $WORKSPACE --location eastus2 \
  --sku PerGB2018 --retention-time 365
az keyvault create --name $KV --resource-group $LOG_RG \
  --location eastus2 --sku standard --retention-days 90
# Store workspace shared keys in Key Vault, then create Action Group and
# scheduled-query alert for mass export detection (ExportCount > 10 per hour)
Summary
| Concept | Key Point |
|---|---|
| Performance Analyzer | Decomposes visual refresh into DAX query, storage engine, and rendering phases; use "Copy query" to pass slow queries to DAX Studio |
| DAX Studio diagnostics | Server Timings reveal FE vs. SE CPU split; high FE/total ratio indicates formula engine bottlenecks requiring iterator rewrites or variable caching |
| Aggregation tables | Pre-materialized Import-mode summaries with transparent DirectQuery fallback; requires Premium or Fabric |
| Composite model design | Dimensions and aggregations in Import, detail facts in DirectQuery; cross-island joins materialize in memory |
| Usage metrics | Built-in covers 90 days per artifact; Admin monitoring workspace covers full tenant; REST API enables custom long-term pipelines |
| Activity Log retention | Native API retains 30 days only; compliance programs must export to Log Analytics (KQL) or Azure Storage (archival) |
| Impact analysis | Run "View impact" before any schema change to enumerate downstream reports and active user counts |
| Data Lineage view | Workspace-scoped DAG; extend to tenant-wide and source-to-dashboard lineage via Microsoft Purview / Fabric scanning |
Chapter: 12 of 12 | Status: v0.1 Draft |