Power BI Data Analyst PL-300: Complete Exam Preparation and Enterprise Patterns
DAX Fundamentals and Evaluation Context
DAX (Data Analysis Expressions) is the formula language that separates superficial Power BI users from analysts who can answer any business question the data supports. Mastering DAX requires internalising two foundational ideas — evaluation context and context transition — because every function either creates, modifies, or depends on these invisible filters that Power BI maintains around every calculation.
Calculated Columns Versus Measures: Choosing the Right Tool
The Fundamental Distinction
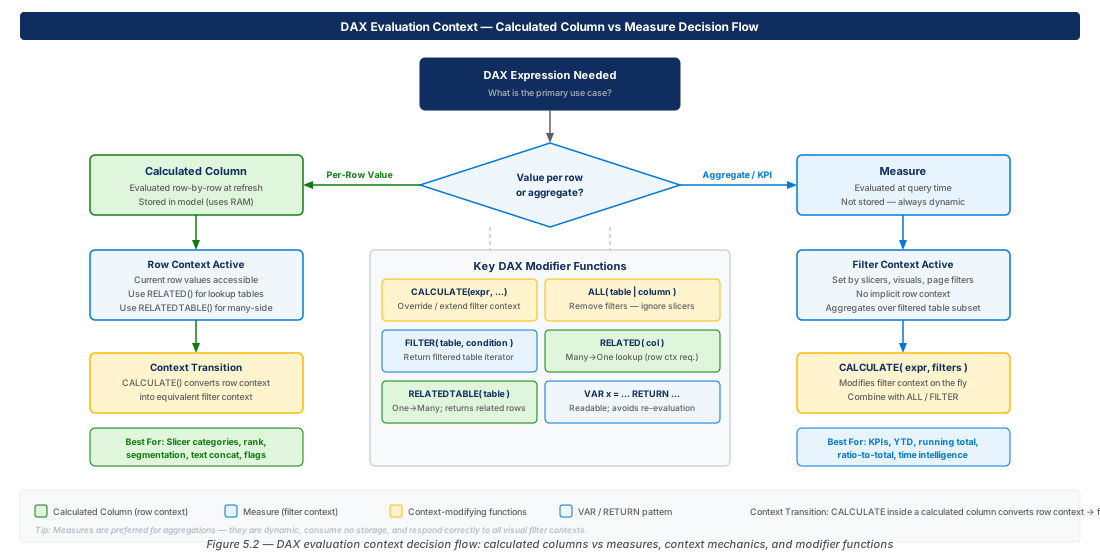
A calculated column is evaluated once at data-refresh time and its results are written to the VertiPaq columnar store alongside imported data. Each row receives a concrete scalar value that is compressed, indexed, and queryable as a slicer, filter dimension, relationship key, or RLS predicate — at essentially no query-time cost.
A measure is never computed until a visual requests it. The expression is evaluated fresh on every query, respecting the filter context active at that moment — slicers, matrix headers, cross-filter from other visuals. Measures carry no storage cost beyond the expression text; this deferred, context-sensitive evaluation is what makes them the correct tool for every aggregation.
When to Use Each Type
Use a calculated column when a value describes a single row independently of viewing context: concatenating a display label, bucketing into "Low / Medium / High," extracting a month number, or deriving a surrogate key. The test: does every row have exactly one correct answer regardless of what the user filters? If yes, a calculated column is appropriate.
Use a measure whenever the result is an aggregation or must change with the filter context: revenue totals, margin percentages, customer counts, period-over-period growth, and running totals are all measures.
Important
Calculated columns increase the model's in-memory footprint proportionally to row count. A 50-million-row fact table with ten unnecessary calculated columns can consume gigabytes of Premium capacity RAM. Audit and migrate to measures or Power Query transformations wherever row-level storage is not required.
| Characteristic | Calculated Column | Measure |
|---|---|---|
| When evaluated | At data refresh | At query time |
| Storage | Written to VertiPaq | Expression only — not stored |
| Slicer / filter available | Yes | No |
| Relationship key | Yes | No |
| Responds to user filters | No (value is fixed) | Yes |
| Memory impact | Proportional to row count | Negligible |
| Syntax context | Row context | Filter context |
PL-300 Exam Tip
Any scenario describing "a value that changes based on the slicer selection" is a measure. Any scenario describing "a column I can use to group rows" is a calculated column. This heuristic resolves the majority of exam questions on this topic.
Row Context and Filter Context: The Two Engines of DAX
Row Context Explained
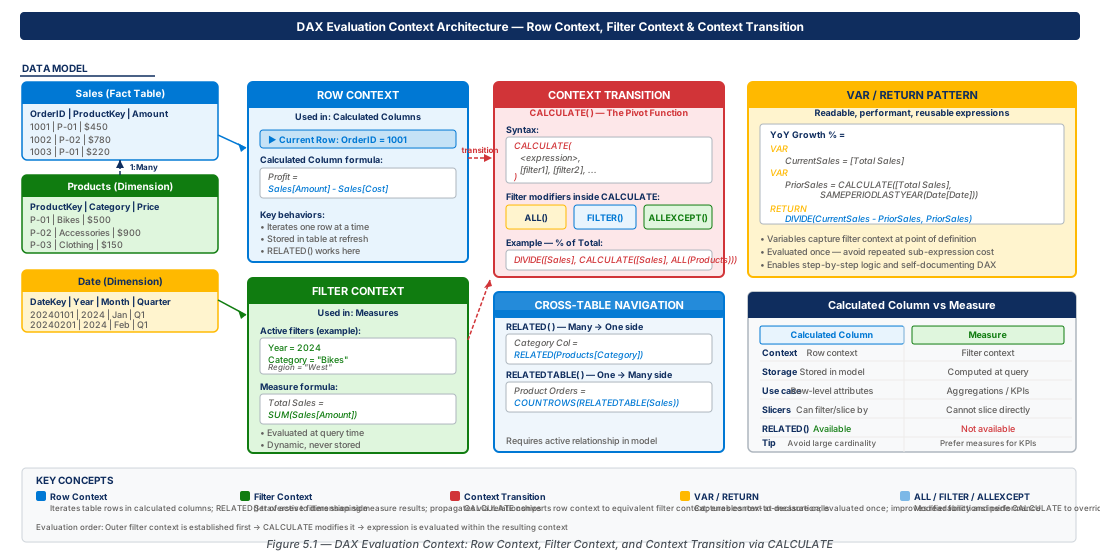
Row context exists whenever DAX iterates table rows one at a time. It is established automatically in two places: when a calculated column is evaluated (Power BI iterates every row), and inside iterator functions — SUMX, AVERAGEX, MAXX, MINX, RANKX, FILTER — as they process each row. Within row context, Sales[Revenue] returns the value for the specific row being processed; there is no hidden aggregation.
Row context does not cross relationships automatically. Referencing Product[Category] while iterating Sales rows raises an error unless you use RELATED. Row context also does not filter data — it simply tracks "which row am I currently on?"
Filter Context Explained
Filter context is the set of filters restricting which rows participate in the current calculation. It is established from the outside: slicers, page and report filters, and visual row/column headers. Every measure evaluation begins by consulting the current filter context — SUM(Sales[Revenue]) totals only rows that survive the active filters, not the entire table.
Filter context propagates automatically through relationships from the "one" side to the "many" side. A Product filter flows to Sales rows without any explicit code. Bidirectional filter direction settings modify this default single-direction propagation.
Note
Filter context and row context can coexist. An iterator like SUMX establishes row context as it walks rows, but the measure calling SUMX still operates inside the current filter context — SUMX only iterates rows that pass the outer filters, while simultaneously establishing row context for its inner expression.
Context Transition: The Bridge Between the Two
Context transition converts a row context into an equivalent filter context. It fires automatically whenever a measure is evaluated inside a row context — in a calculated column expression or inside an iterator. DAX creates a filter context containing all column values of the current row, then evaluates the measure within that new context. The result propagates through relationships, so a measure called from a Customer-table calculated column correctly returns only that customer's revenue.
Warning
Context transition inside a large-table iterator is a top cause of slow DAX. SUMX(Sales, [Complex Measure]) on 10 million rows triggers 10 million full measure evaluations with relationship traversal. Rewrite using native aggregators or push the computation to Power Query.
CALCULATE, FILTER, and ALL: Controlling Filter Context
The CALCULATE Function
CALCULATE is the most important function in DAX — every meaningful measure either calls it directly or calls a function that wraps it. Its purpose: evaluate an expression inside a modified filter context. Filter arguments that target an already-filtered column override (replace) the existing filter; arguments targeting unfiltered columns add new filters.
-- Override year filter regardless of slicer selection
Revenue 2024 =
CALCULATE(
    [Total Revenue],
    'Date'[Year] = 2024
)

-- Multiple filter modifiers applied simultaneously
Revenue East 2024 =
CALCULATE([Total Revenue], 'Date'[Year] = 2024, Customer[Region] = "East")
The FILTER Function
FILTER is a table function — it returns a table, not a scalar — and can only appear where a table argument is accepted: as a filter argument to CALCULATE, or as the input to an iterator. It iterates every row and returns only those matching the Boolean expression. For simple single-column predicates, prefer the direct column-filter syntax inside CALCULATE (Sales[Revenue] > 10000) over FILTER(Sales, ...), which performs a full scan and is more expensive on large fact tables.
-- Multi-column condition requires FILTER (full scan)
High Value Revenue =
CALCULATE([Total Revenue],
    FILTER(Sales, Sales[Revenue] > 10000 && Sales[Discount] < 0.1))

-- Efficient single-column alternative (VertiPaq index used)
High Value Revenue (Efficient) =
CALCULATE([Total Revenue], Sales[Revenue] > 10000)
The ALL Function and Its Variants
ALL removes filters from the filter context when used inside CALCULATE. ALL(Table) removes all column filters on a table; ALL(Table[Column]) removes the filter on one column. ALL is the foundation for percent-of-total and ratio measures. The ALL family also includes ALLEXCEPT, ALLSELECTED, and REMOVEFILTERS — each targeting a specific scope of filter removal.
Revenue % of Total =
DIVIDE([Total Revenue], CALCULATE([Total Revenue], ALL(Sales)))

Revenue % of Category =
DIVIDE([Total Revenue],
    CALCULATE([Total Revenue], ALLEXCEPT(Product, Product[Category])))

Revenue % of Visual Total =
DIVIDE([Total Revenue], CALCULATE([Total Revenue], ALLSELECTED(Product)))| Function | What It Removes | Typical Use Case |
|---|---|---|
ALL(Table) | All filters on all columns | Grand total denominator |
ALL(Table[Column]) | Filter on one column | Clear a single slicer effect |
ALLEXCEPT(Table, Col…) | All filters except listed columns | Subtotal within a group |
ALLSELECTED(Table) | Visual-level filters only | % of visual total |
REMOVEFILTERS(Table) | Same as ALL — more explicit | Modern preferred syntax |
KEEPFILTERS(filter) | Intersects instead of overriding | Preserve slicer while adding a filter |
Important
ALL only acts as a filter modifier when it is a direct argument to CALCULATE (or a function that internally calls CALCULATE). When used standalone as a table reference — e.g., the input to SUMX — it simply returns all rows of the table and does not modify any filter context.
RELATED and RELATEDTABLE: Navigating Relationships in DAX
RELATED: Looking Up Values Across a Relationship
RELATED retrieves a single value from a related table by navigating from the "many" side to the "one" side. It is only valid inside row context (calculated columns or iterators) and requires an active relationship in the model. Use it to enrich fact-table rows with dimension attributes — product categories, customer segments, or price-list values.
-- Bring product category into the Sales fact table
Sales[ProductCategory] = RELATED(Product[Category])

-- Row-level margin using related list price
Sales[MarginPercent] =
DIVIDE(Sales[Revenue] - Sales[Cost], RELATED(Product[ListPrice]))
RELATEDTABLE: Retrieving Multiple Rows from a Related Table
RELATEDTABLE navigates from the "one" side to the "many" side and returns an entire table — all child rows associated with the current row. Because it returns a table, it is almost always wrapped in COUNTROWS, SUMX, MAXX, or AVERAGEX. It is most useful in dimension-table calculated columns for pre-computing statistics about related fact rows.
-- Count sales transactions per customer
Customer[TransactionCount] = COUNTROWS(RELATEDTABLE(Sales))

-- Flag customers with at least one high-value order
Customer[HasHighValueOrder] =
IF(MAXX(RELATEDTABLE(Sales), Sales[Revenue]) > 50000, "Yes", "No")Warning
RELATEDTABLE inside a calculated column on a large dimension table multiplies refresh cost — 500 K customers × 50 M sales rows means 500 K relationship traversals at refresh. Consider computing these aggregates in Power Query or accepting the measure trade-off.
Choosing Between RELATED and RELATEDTABLE
Navigation direction determines which function to use. Writing on the "many" side and retrieving a single parent value: use RELATED (follows the relationship arrow). Writing on the "one" side and aggregating child rows: use RELATEDTABLE (goes against the arrow). On the exam, "for each product, calculate the total…" is RELATEDTABLE; "for each sales row, bring in the product's…" is RELATED.
VAR/RETURN: Readable and Performant DAX Expressions
The VAR/RETURN Syntax
VAR declares a named variable storing a DAX expression result; RETURN specifies the final output, referencing one or more variables. Multiple VARs can precede a single RETURN. The pattern converts deeply nested, repetitive expressions into labelled intermediate steps that are easier to read and debug.
Revenue Growth % =
VAR CurrentRevenue = [Total Revenue]
VAR PriorRevenue =
    CALCULATE([Total Revenue], SAMEPERIODLASTYEAR('Date'[Date]))
VAR GrowthAmount = CurrentRevenue - PriorRevenue
RETURN
    DIVIDE(GrowthAmount, PriorRevenue)
Performance Benefits of VAR
The key performance gain: an intermediate result computed by a VAR is evaluated once in the final RETURN filter context and reused. Without VAR, referencing the same expensive expression twice — e.g., SAMEPERIODLASTYEAR in both the numerator and denominator — triggers two full evaluations. With VAR, DAX evaluates it once and stores the scalar.
Tip
Use descriptive variable names: VAR SalesAmountCurrentYear, VAR PreviousYearSales, VAR GrowthRate. Self-documenting names eliminate the need for explanatory comments and make peer review significantly faster.
Handling Blank and Error Conditions with VAR
The VAR/RETURN pattern enables elegant BLANK and error handling without nested IF/IFERROR calls. Assign the potentially-blank value to a variable, test it once in RETURN, and respond cleanly. Variables in DAX are immutable — you cannot reassign a name; build successive VARs for multi-step transformations.
YoY Revenue Growth % =
VAR CurrentRevenue = [Total Revenue]
VAR PriorRevenue =
    CALCULATE([Total Revenue], SAMEPERIODLASTYEAR('Date'[Date]))
RETURN
    IF(NOT ISBLANK(PriorRevenue),
        DIVIDE(CurrentRevenue - PriorRevenue, PriorRevenue),
        BLANK())
Core Aggregation, Logical, and Text Functions for PL-300
Aggregation Functions
Basic aggregators — SUM, AVERAGE, MIN, MAX, COUNT, COUNTA, COUNTBLANK, COUNTROWS — operate on a single column or table. Iterator variants — SUMX, AVERAGEX, MINX, MAXX, RANKX — accept a table and an expression, compute per row, then aggregate. DISTINCTCOUNT counts unique non-blank values; COUNTROWS counts all rows including those with blank columns.
Transaction Count = COUNTROWS(Sales)
Distinct Customer Count = DISTINCTCOUNT(Sales[CustomerKey])

-- Iterator for row-level expression before aggregating
Revenue After Discount =
SUMX(Sales, Sales[Quantity] * Sales[UnitPrice] * (1 - Sales[DiscountPct]))
Logical Functions
IF, IFERROR, and SWITCH control expression flow. SWITCH(TRUE(), ...) evaluates a sequence of Boolean conditions and returns the result for the first TRUE — the standard pattern for multi-tier classification, custom sort expressions, and dynamic measure selection. It is far more readable than nested IFs when there are three or more branches.
Sales Performance Band =
VAR Revenue = [Total Revenue]
RETURN
SWITCH(TRUE(),
    Revenue >= 1000000, "Enterprise",
    Revenue >= 500000,  "Strategic",
    Revenue >= 100000,  "Growth",
    "Core")
Text Functions
Text functions operate at row level and suit calculated columns: CONCATENATE (&), LEFT, RIGHT, MID, LEN, UPPER, LOWER, TRIM, SUBSTITUTE, FORMAT, and VALUE. FORMAT is the most versatile — converting numeric and date values to display strings with locale-aware formatting. Use it to build display-friendly labels in calculated columns or dynamic titles in measures.
Customer[DisplayName] = Customer[FirstName] & " " & Customer[LastName]
Customer[AreaCode] = LEFT(Customer[Phone], 3)
Product[NormalisedCode] = UPPER(TRIM(Product[RawCode]))
Sales[RevenueFormatted] = FORMAT(Sales[Revenue], "$#,##0.00")
Lab: Provision the DAX Practice Environment in Azure
CE-09 — Deploy Azure SQL Database with AdventureWorks Sample Data
Provision a dedicated resource group and a serverless Azure SQL Database seeded with the AdventureWorksDW sample. Retrieve the FQDN for use in Power BI Desktop connection dialogs.
# CE-09: Provision Azure SQL Database for DAX lab exercises
az login && az account set --subscription "PL-300-Training-Subscription"

az group create --name rg-dax-fundamentals-evaluation-context-dev-001 \
  --location eastus2 --tags environment=dev project=pl-300-dax-lab

az sql db create --resource-group rg-dax-fundamentals-evaluation-context-dev-001 \
  --server dax-fundamentals-prod-eastus2-001 --name AdventureWorksDW \
  --sample-name AdventureWorksDW --edition GeneralPurpose \
  --compute-model Serverless --auto-pause-delay 60

# Retrieve FQDN for Power BI Desktop: Server field
az sql server show --resource-group rg-dax-fundamentals-evaluation-context-dev-001 \
--name dax-fundamentals-prod-eastus2-001 --query fullyQualifiedDomainName --output tsvCE-10 — Deploy Gateway VM and Configure Scheduled Refresh
Provision a Windows Server 2022 VM in a dedicated production resource group to host the on-premises data gateway, then configure auto-shutdown to minimise cost. After RDP, install the gateway and add the AdventureWorksDW data source pointing to the server deployed in CE-09.
# CE-10: Deploy gateway VM for scheduled refresh
az group create --name rg-dax-fundamentals-evaluation-context-prod-001 \
  --location eastus2 --tags environment=prod project=pl-300-dax-lab

az vm create --resource-group rg-dax-fundamentals-evaluation-context-prod-001 \
  --name vm-dax-gateway-prod-eastus2-001 --image Win2022AzureEditionCore \
  --size Standard_D2s_v5 --public-ip-sku Standard \
  --admin-username daxgatewayadmin

# Auto-shutdown at 19:00 UTC to control costs
az vm auto-shutdown --resource-group rg-dax-fundamentals-evaluation-context-prod-001 \
  --name vm-dax-gateway-prod-eastus2-001 --time 1900
Summary
| Concept | Key Point |
|---|---|
| Calculated columns vs measures | Columns are materialised at refresh, stored per row, usable as slicers and relationship keys. Measures are computed at query time and respond to filter context. |
| Row context | Created by calculated columns and iterator functions. References current-row column values; does not cross relationships without RELATED. |
| Filter context | The active set of filters from slicers, visuals, and CALCULATE. Propagates automatically from one to many through relationships. |
| Context transition | Fires when a measure is called inside a row context. Converts current-row column values into an equivalent filter context. Can be a severe performance bottleneck inside large iterators. |
| CALCULATE | Evaluates an expression in a modified filter context. Filter arguments override (not add to) existing filters on the same column. |
| ALL / ALLSELECTED / ALLEXCEPT | ALL removes all filters (grand total); ALLEXCEPT removes all but specified columns (group subtotal); ALLSELECTED preserves slicers while clearing visual filters (% of visual total). |
| RELATED / RELATEDTABLE | RELATED navigates many-to-one (single value); RELATEDTABLE navigates one-to-many (table of child rows). Direction determines which function to use. |
| VAR/RETURN | Assigns intermediate results to named immutable variables evaluated once in the final filter context. Eliminates redundant computation and enables clean BLANK/error handling. |
Chapter: 5 of 12 | Status: v0.1 Draft |