Power BI Data Analyst PL-300
Advanced DAX: Time Intelligence and Statistical Patterns
Time intelligence transforms a static data model into a dynamic analytical engine — it is the difference between reporting what happened and understanding how performance evolves across periods, years, and custom calendars. This chapter covers the advanced DAX function families that separate high scorers on the PL-300 exam: time intelligence functions, iterator aggregations, semi-additive measures, and parent-child hierarchy traversal.
Date Table Foundations: The Non-Negotiable Prerequisite
Before a single time intelligence function will evaluate correctly, the data model must contain a properly configured date table. Power BI enforces this requirement at the engine level, and exam questions routinely test whether candidates understand what "properly configured" actually means.
Anatomy of a Compliant Date Table
A compliant date table must satisfy three conditions: a contiguous gap-free Date column, that column marked via Mark as Date Table, and a relationship to at least one fact table on a date-typed column. The canonical PL-300 pattern uses ADDCOLUMNS over CALENDAR:
DimDate =
ADDCOLUMNS(
    CALENDAR(DATE(2020,1,1), DATE(2026,12,31)),
    "Year",        YEAR([Date]),
    "MonthNum",    MONTH([Date]),
    "MonthName",   FORMAT([Date], "MMMM"),
    "FiscalYear",  IF(MONTH([Date]) >= 7, "FY" & YEAR([Date])+1, "FY" & YEAR([Date]))
) -- Adjust >= 7 threshold to match your organization's fiscal year startImportant
Fiscal columns require domain-specific adjustment. The formula above assumes a July-to-June fiscal year. Misaligned fiscal columns produce measures that appear plausible but silently shift by one period.
Marking and Relating the Date Table
Right-click the table in the Fields pane, select Mark as Date Table, and choose the Date column. This disables auto date/time and enables the time intelligence engine. The relationship from DimDate[Date] to the fact table should be single-direction many-to-one; bidirectional relationships introduce filter context ambiguity and should be avoided.
Note
Multiple active date relationships (OrderDate, ShipDate, DueDate) require USERELATIONSHIP inside CALCULATE to activate alternates. The exam frequently tests this pattern in order fulfillment analysis scenarios.
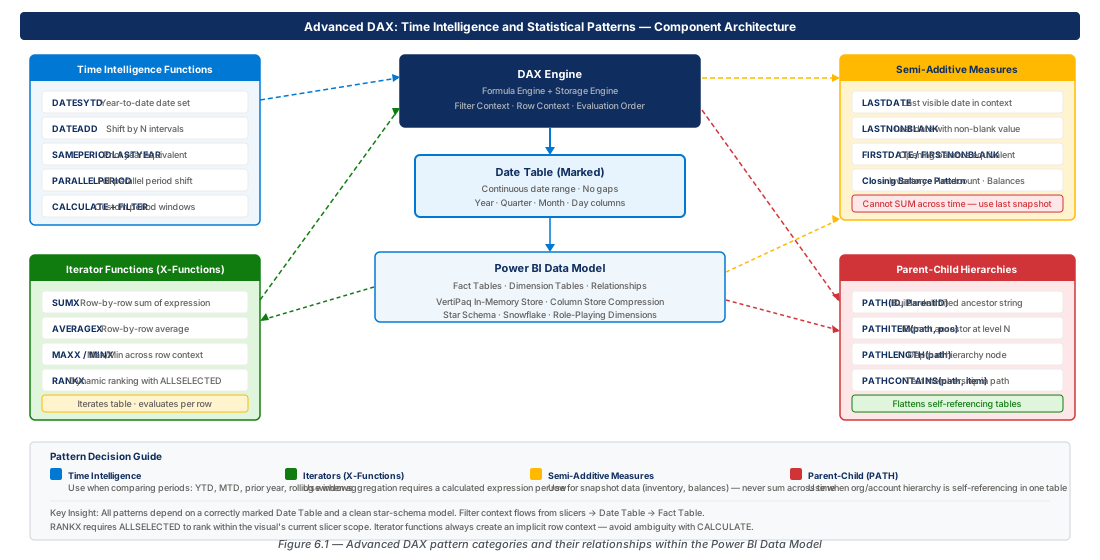
Time Intelligence Functions: Shifting and Accumulating Periods
Time intelligence functions return a modified table of dates used as a filter argument inside CALCULATE. Understanding that these functions return date tables — not scalars — resolves most confusion about unexpected behavior in certain filter contexts.
Year-to-Date Accumulation with DATESYTD
DATESYTD returns all dates from period start to the last date in the current filter context — the natural choice for cumulative sales and budget consumption. For fiscal YTD, pass the fiscal year-end date as the second argument:
Sales YTD = CALCULATE([Total Sales], DATESYTD(DimDate[Date]))

Sales Fiscal YTD = CALCULATE([Total Sales], DATESYTD(DimDate[Date], "6/30"))
-- Second arg is fiscal year LAST day (MM/DD). July–June fiscal = "6/30", not "7/1"Tip
Always pair a YTD measure with prior-year YTD for variance analysis: CALCULATE([Sales YTD], SAMEPERIODLASTYEAR(DimDate[Date])) gives management the cumulative gap at any point in the year.
Parallel Period Comparison with DATEADD and PARALLELPERIOD
DATEADD shifts every date in the current filter by the specified offset, preserving partial periods. PARALLELPERIOD returns the entire period containing the shifted dates — always a full month, quarter, or year even when the current selection is partial.
-- Preserves partial months; use for exact date-shifted comparison
Sales PY (DATEADD) = CALCULATE([Total Sales], DATEADD(DimDate[Date], -1, YEAR))

-- Always returns a full period; use for complete prior-period reports
Sales PY (PARALLELPERIOD) = CALCULATE([Total Sales], PARALLELPERIOD(DimDate[Date], -1, YEAR))Warning
PARALLELPERIOD with a multi-month selection expands to the full enclosing months last year. A Dec 15–Jan 15 selection returns all of December and January of the prior year — document this in report tooltips to prevent user confusion.
Same-Period Comparisons with SAMEPERIODLASTYEAR
SAMEPERIODLASTYEAR is syntactic sugar for DATEADD(DimDate[Date], -1, YEAR). It is the version exam questions use for "year-over-year" scenarios. Pair it with DIVIDE to avoid blank propagation in the first year of operation:
Sales PY = CALCULATE([Total Sales], SAMEPERIODLASTYEAR(DimDate[Date]))

YoY Growth % = DIVIDE([Total Sales] - [Sales PY], [Sales PY], 0)
-- DIVIDE with 0 as alternate prevents blank suppression on sparklines
Comparing Time Intelligence Functions
| Function | Interval Options | Returns Partial Periods | Primary Use Case |
|---|---|---|---|
DATESYTD | Year (fiscal year-end configurable) | Yes | Cumulative YTD totals |
DATESMTD | Month | Yes | Cumulative MTD totals |
DATESQTD | Quarter | Yes | Cumulative QTD totals |
DATEADD | Day, Month, Quarter, Year | Yes | Flexible period shifts |
PARALLELPERIOD | Month, Quarter, Year | No — always full periods | Full-period prior comparisons |
SAMEPERIODLASTYEAR | Year only | Yes | Standard YoY comparisons |
PREVIOUSMONTH | Month | No | Month-over-month in tables |
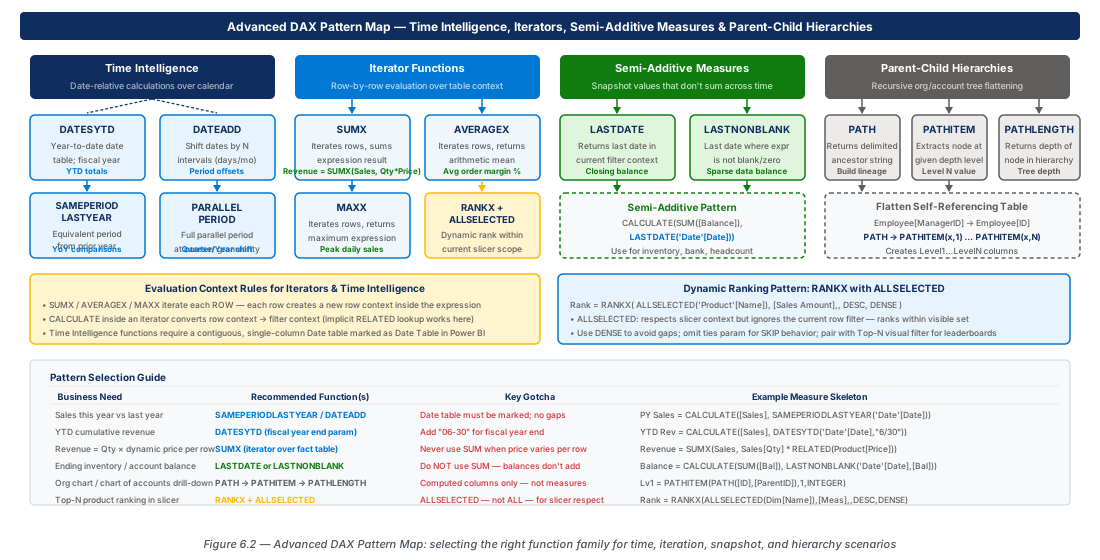
RANKX and Dynamic Ranking with ALLSELECTED
Ranking measures are among the most visually impactful and technically nuanced patterns in Power BI. A naive RANKX(ALL(DimProduct), [Total Sales]) ranks every product globally — useful for a leaderboard but useless when a regional slicer should constrain the ranking to the selected region's products.
RANKX Internals: How Ranking Evaluates
RANKX takes five arguments: the table to rank over, the expression, an optional value, the order (ASC/DESC), and ties handling (SKIP or DENSE). Without ALL on the first argument, the table is filtered to only the current row and every row ranks first.
-- Global rank — ignores all slicers
Product Rank Global =
RANKX(ALL(DimProduct[ProductName]), [Total Sales],, DESC, SKIP)

-- Slicer-aware rank — respects active filters except the product dimension
Product Rank Dynamic =
RANKX(ALLSELECTED(DimProduct[ProductName]), [Total Sales],, DESC, SKIP)
Dynamic Ranking with ALLSELECTED
ALLSELECTED removes filters applied by the current visual's own field while preserving filters from external slicers and cross-filters. This produces the intuitive behavior that users expect: the ranking reflects the filtered universe visible in the current view. A Top N pattern pairs this with a What-If parameter:
Top N Flag =
VAR CurrentRank = [Product Rank Dynamic]
VAR N = SELECTEDVALUE(TopNParameter[Value], 10)
RETURN IF(CurrentRank <= N, 1, 0)
-- Use as a visual-level filter (Top N Flag = 1) for interactive Top N visualsImportant
ALLSELECTED honors visual-level filters, not just slicers. If a visual-level filter reduces the product list to one item, all values rank 1. Test ranking measures with both slicer-based and visual-level filters before production deployment.
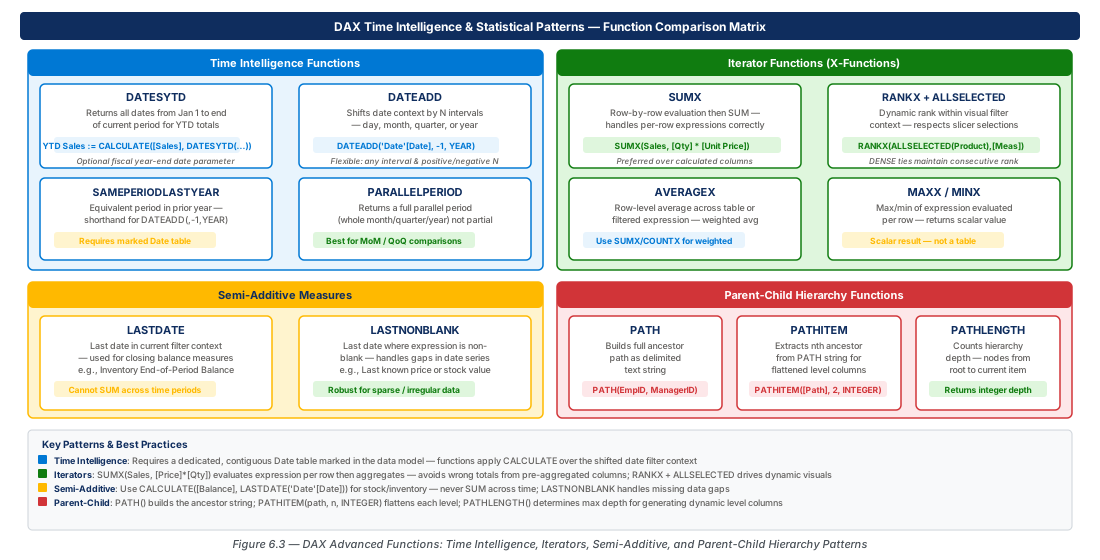
Iterator Functions: SUMX, AVERAGEX, MAXX, and the Row Context
Iterator functions evaluate an expression row-by-row over a table then aggregate the results. The X suffix distinguishes them from scalar equivalents — SUM adds an existing column's values; SUMX computes an expression per row first. This distinction is critical when the value to aggregate must be calculated per row.
When to Use SUMX Instead of SUM
The canonical SUMX scenario is line-item revenue where no LineRevenue column exists. SUM(Qty) * SUM(Price) multiplies totals, producing the wrong answer; SUMX multiplies per row then aggregates correctly:
-- Wrong: multiplies totals, not row-level products
Revenue Wrong = SUM(Sales[Quantity]) * SUM(Sales[UnitPrice])

-- Correct: per-row multiply then sum
Revenue Correct = SUMX(Sales, Sales[Quantity] * Sales[UnitPrice])Tip
Use SUMX when the expression varies by filter context (e.g., a discount rate driven by slicers). If the arithmetic is always static, a calculated column is faster and avoids row-scan cost at query time.
AVERAGEX and MAXX for Conditional Aggregations
AVERAGEX computes an expression per row and returns the arithmetic mean of non-blank results — the correct tool for average basket size when basket value is not a stored column. MAXX returns the maximum expression value across the iteration, useful for identifying the best single-day revenue in the current period:
Avg Basket Size =
AVERAGEX(VALUES(Sales[OrderID]), CALCULATE(SUM(Sales[Quantity] * Sales[UnitPrice])))

Max Daily Revenue =
MAXX(VALUES(DimDate[Date]), CALCULATE([Total Sales]))Note
MINX, MAXX, SUMX, AVERAGEX, COUNTAX, and COUNTX all share the same two-argument signature: FUNCTIONX(table, expression). Mastering one unlocks them all — the pattern is consistent across every iterator.
Semi-Additive Measures: LASTDATE and LASTNONBLANK
Semi-additive measures aggregate correctly across some dimensions but not time. Account balance can be summed across accounts but not across periods — the correct time aggregation is the snapshot at the last date, not a cumulative total.
Inventory and Balance Snapshot with LASTDATE
LASTDATE returns the last date in the current filter context as a single-row table. Wrapped in CALCULATE, it restricts evaluation to snapshot data for that date — June shows the June 30 balance, Q2 shows June 30 (not the sum of month-end balances):
Inventory Balance =
CALCULATE(SUM(InventoryFact[UnitsOnHand]), LASTDATE(DimDate[Date]))Warning
LASTDATE returns the last calendar date in context, not the last date with data. If inventory is recorded only on business days, month-end snapshots may return blank. Use LASTNONBLANK for sparse data.
Handling Sparse Data with LASTNONBLANK
LASTNONBLANK scans dates in reverse chronological order and returns the last date where a specified expression is non-blank. This is the production-grade version for real-world datasets where daily snapshots may not exist for every calendar date:
Account Balance (Last Non-Blank) =
CALCULATE(
    SUM(AccountFact[Balance]),
    LASTNONBLANK(DimDate[Date], CALCULATE(COUNTA(AccountFact[Balance])))
)
-- COUNTA returns non-blank when at least one record exists for that date
Choosing Between LASTDATE and LASTNONBLANK
| Scenario | Recommended Function | Rationale |
|---|---|---|
| Data exists for every calendar date | LASTDATE | Simpler, faster, no scan overhead |
| Data exists only on business days | LASTNONBLANK | Avoids zero/blank on non-trading days |
| Fiscal month-end snapshots | LASTNONBLANK | Snapshot dates may not align with calendar month-end |
| High-frequency tick data | LASTDATE | Data density ensures last date always has records |
| Slowly-changing dimension balances | LASTNONBLANK | Changes are infrequent; most dates have no record |
Parent-Child Hierarchies: PATH, PATHITEM, and PATHLENGTH
Organizational charts, account plan structures, and bill-of-materials relationships use self-referencing tables where each row points to its parent via a foreign key on the same table. Power BI's three PATH functions flatten these variable-depth structures into fixed-level columns compatible with native hierarchy visuals.
PATH: Building the Ancestor Chain
PATH returns a pipe-delimited string containing the complete ancestor chain from root to current node. The root node must have a null or blank parent value — a self-referential root causes an infinite loop and a circular dependency error:
EmployeePath =
PATH(DimEmployee[EmployeeID], DimEmployee[ManagerID])
-- CEO (EmployeeID=1, ManagerID=null) → "1"
-- Analyst (depth 5) → "1|5|23|47|312"  (root left, current right)
PATHITEM and PATHLENGTH for Flattening Levels
PATHITEM extracts a node by position; PATHLENGTH returns total node count (depth). Create one LevelN calculated column per hierarchy depth, then combine them into a user-defined hierarchy in the Fields pane:
HierarchyDepth = PATHLENGTH(DimEmployee[EmployeePath])
Level1 = PATHITEM(DimEmployee[EmployeePath], 1)
Level2 = PATHITEM(DimEmployee[EmployeePath], 2)
-- Use PATHITEMREVERSE(path, 2) to always get the direct manager regardless of depthTip
PATHITEMREVERSE(DimEmployee[EmployeePath], 2) always returns the direct manager regardless of hierarchy depth — the second-to-last node in the path string.
Producing Rollup Totals with PATHCONTAINS
Standard DAX aggregation handles rollup automatically through filter context — a Level1 filter on "North America" includes all subordinate employees' rows. For counting all subordinates at any depth, use PATHCONTAINS in a calculated column:
Subordinate Count =
CALCULATE(
    COUNTROWS(DimEmployee),
    FILTER(DimEmployee,
        PATHCONTAINS(DimEmployee[EmployeePath], EARLIER(DimEmployee[EmployeeID])))
)
-- Counts everyone whose path contains the current manager's ID at any depth
Lab: Deploying and Validating Time Intelligence Measures
These two cloud exercises operationalize the DAX patterns from this chapter — provisioning a Power BI Premium embedded capacity, deploying a PBIX with time intelligence measures, and validating results via the Power BI REST API in a CI/CD-compatible pattern.
CE-11: Provision Power BI Embedded Capacity and Deploy Dataset
Create resource groups, provision an A1 embedded capacity, create a workspace via REST API, assign it to the capacity, and upload the PBIX file containing time intelligence measures.
# CE-11: Provision Power BI Premium resources and deploy time-intelligence dataset
SUBSCRIPTION_ID="xxxxxxxx-xxxx-xxxx-xxxx-xxxxxxxxxxxx"
RESOURCE_GROUP_PROD="rg-advanced-dax-time-intelligence-prod-001"
LOCATION="eastus2"; CAPACITY_NAME="advanced-dax-prod-eastus2-001"
PBI_WORKSPACE="ws-advanced-dax-prod-001"
ADMIN_EMAIL="chakravarthy_b@infosys.com"

az login --service-principal --username "${SP_APP_ID}" --password "${SP_SECRET}" --tenant "${TENANT_ID}"
az account set --subscription "${SUBSCRIPTION_ID}"
az group create --name "${RESOURCE_GROUP_PROD}" --location "${LOCATION}" --tags environment=prod workload=powerbi-dax
az powerbi embedded-capacity create --resource-group "${RESOURCE_GROUP_PROD}" --name "${CAPACITY_NAME}" \
  --location "${LOCATION}" --sku-name A1 --sku-tier PBIE_Azure --administration-members "[\"${ADMIN_EMAIL}\"]"
# ... retrieve CAPACITY_ID, create workspace via REST API, assign to capacity, upload PBIXCE-12: Validate Time Intelligence Measures with DAX Query Testing
Execute DAX queries against the deployed dataset via the Power BI REST API to validate YTD measures, dynamic ranking, semi-additive inventory balances, and parent-child hierarchy structure. Tag resources with the validation timestamp upon success.
# CE-12: Execute DAX queries via REST API to validate time intelligence measures
ACCESS_TOKEN=$(az account get-access-token --resource "https://analysis.windows.net/powerbi/api" --query accessToken --output tsv)

YTD_RESULT=$(curl -s -X POST "https://api.powerbi.com/v1.0/myorg/groups/${WORKSPACE_ID}/datasets/${DATASET_ID}/executeQueries" \
  -H "Authorization: Bearer ${ACCESS_TOKEN}" -H "Content-Type: application/json" \
  -d '{"queries":[{"query":"EVALUATE SUMMARIZECOLUMNS(DimDate[Year],\"SalesYTD\",[Sales YTD])"}]}')
echo "${YTD_RESULT}" | jq '.results[0].tables[0].rows'

VALIDATION_TIMESTAMP=$(date -u +"%Y-%m-%dT%H:%M:%SZ")
az group update --name "rg-advanced-dax-time-intelligence-prod-001" \
  --set tags.last_validated="${VALIDATION_TIMESTAMP}" tags.validation_status="passed"
echo "Status: All measures validated — ${VALIDATION_TIMESTAMP}"
Summary
This chapter covered the advanced DAX patterns that appear most frequently on the PL-300 exam and in production Power BI deployments.
| Concept | Key Point |
|---|---|
| Date Table Prerequisite | Every time intelligence function requires a marked, gap-free date table; missing this produces silent errors, not explicit failures |
| DATESYTD / DATESMTD / DATESQTD | Return all dates from period start to last date in filter; use "6/30" as second argument of DATESYTD for July–June fiscal years |
| DATEADD vs PARALLELPERIOD | DATEADD preserves partial periods; PARALLELPERIOD always returns complete periods — choose based on whether partial comparisons should be exact or full-period |
| RANKX with ALLSELECTED | ALL ranks globally; ALLSELECTED ranks within the currently filtered universe, making ranking slicer-responsive without separate measures |
| Iterator Functions (SUMX, AVERAGEX, MAXX) | Evaluate an expression row-by-row then aggregate; required when the value must be computed per row rather than read from an existing column |
| Semi-Additive Measures | Use LASTDATE for dense data; use LASTNONBLANK for sparse data (business-day snapshots) to avoid blank on days without records |
| Parent-Child Hierarchies | PATH builds the ancestor string, PATHITEM extracts specific levels, PATHLENGTH returns depth; flatten to fixed-level columns for native Power BI hierarchies |
Chapter: 6 of 12 | Status: v0.1 Draft |