Power BI Data Analyst PL-300
Advanced Analytics, AI Visuals, and Statistical Features
Power BI's AI-powered visuals invoke cloud-hosted Azure ML services at query time, making them both powerful and sensitive to semantic model quality. This chapter provides the architectural depth and configuration guidance to deploy these features correctly and answer every PL-300 question on AI visuals with confidence.
1. Foundations: The AI and Analytics Layer in Power BI
How Power BI AI Features Are Architected
AI visuals send DAX queries to the underlying dataset, then pass result sets to Azure ML pipelines; responses are rendered in the visual container. This round-trip explains data-volume limits, the internet connectivity requirement even in Desktop, and why AI visuals are subject to Premium capacity resource governance. Q&A, Smart Narratives, anomaly detection, and Key Influencers require Pro or Premium Per User (PPU) for authoring; the Decomposition Tree is available for consumption on all tiers.
AI visuals re-compute at query time — no trained model is stored in the .pbix file. Every filter change triggers a fresh analysis, so latency scales with dataset size and explanatory field count.
Note
AI visuals compute results against the live dataset at query time. Every filter change re-runs the analysis — which can cause perceptible latency on large datasets.
The Role of the Semantic Model in AI Visual Quality
Every AI visual draws its analytical signals from fields, measures, and relationships in the semantic model. High-cardinality fields (product SKUs, customer IDs) are poor candidates for influencer analysis; categorical fields used in Key Influencers should have fewer than 150 distinct values. Field names using business terminology rather than database column names, and tables named after business entities, produce dramatically better Q&A NLP results.

2. Key Influencers Visual: Categorical and Continuous Targets
How Key Influencers Works
Key Influencers uses logistic regression (categorical targets) or linear regression (continuous targets) to rank input fields by statistical impact on the target. The "Key influencers" tab shows individual field-value combinations with conditional distribution charts; the "Top segments" tab runs a clustering algorithm to find multivariate segments. The PL-300 exam expects candidates to distinguish correlation from causation — the visual shows statistical association only.
Configuring Categorical Targets
Place a categorical column in the "Analyze" well, then select the specific target value (e.g., "High" for satisfaction). For categorical explanatory fields, the visual computes odds ratios; for numeric fields, it bins values and finds the highest-odds bin. Avoid placing fields logically derived from the target in "Explain by" — this causes data leakage and artificially inflated influence scores.
Important
Placing a field derived from the target in "Explain by" (e.g., explaining "Churned = Yes" using "Last Login Days Ago" when churn is defined by login recency) produces misleadingly high scores. This data leakage is tested explicitly on PL-300.
Configuring Continuous Targets
For numeric measures in the "Analyze" well, the visual switches to regression mode and ranks factors by absolute regression coefficient. Use a DAX measure rather than a raw column to control aggregation logic. Set the minimum segment count to max(30, 1% of population) to prevent micro-segment noise.
Tip
For time-intelligence measures (e.g., Sales YTD) in continuous analysis, verify the date table relationship is active and that the date slicer is within the visual's filter context.
Key Influencers Configuration Reference
| Setting | Categorical Target | Continuous Target | Best Practice |
|---|---|---|---|
| Analyze well | Categorical column | Numeric column or measure | Use measures for business-defined KPIs |
| Explain by fields | Categorical and numeric columns | Categorical and numeric columns | Limit to 10–15 meaningful dimensions |
| Expand by | Optional grouping field | Optional grouping field | Use sparingly; multiplies query count |
| Minimum category count | Min records per segment | Min records per segment | Set to max(30, 1% of population) |
| High cardinality fields | Filter or bin before use | Filter or bin before use | <150 distinct values recommended |
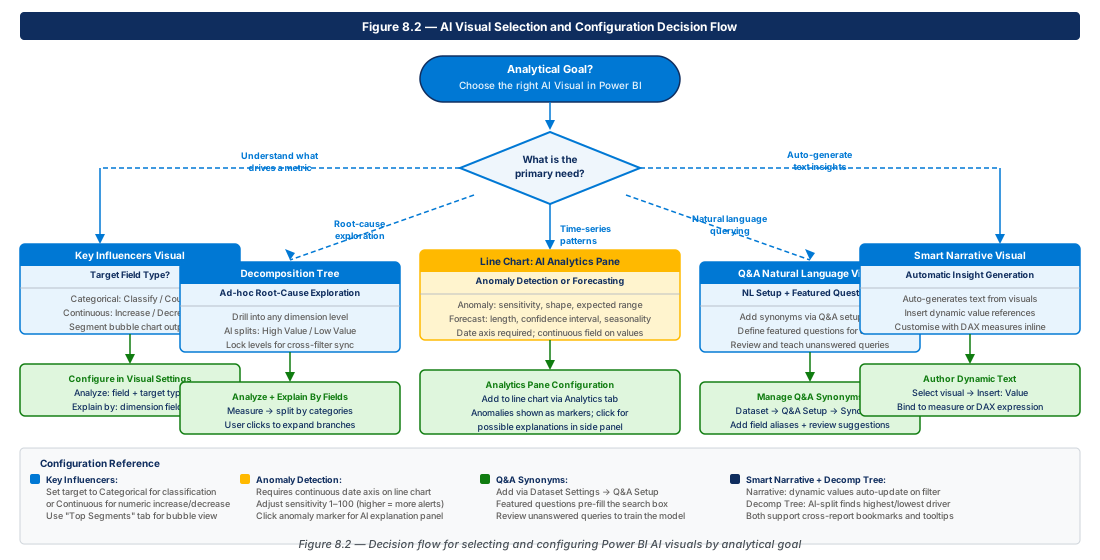
3. Decomposition Tree: Ad-Hoc Root-Cause Exploration
Architecture and Navigation Model
The Decomposition Tree issues one DAX query per expansion level, with each level constrained by all parent-level filter values. Manual mode lets consumers pick any available dimension; AI-driven "High value" / "Low value" splits use a greedy algorithm — locally optimal at each step, not globally optimal. The "Explain by" well accepts only columns, not measures; materialize computed segmentation logic as calculated columns if needed.
Warning
AI splits on large datasets with many high-cardinality fields can be extremely slow. Pre-filter using visual-level filters or RLS before enabling AI splits in production reports.
Locking Levels and Guided Analytics
Report authors can lock specific levels via Format visual > Tree settings, enforcing a business-standard top-level view while preserving consumer flexibility at lower levels. Bookmarks capture the full expansion state — sequence of dimensions and values — enabling curated "starting points" for common root-cause investigations without sacrificing exploratory depth.
Tip
Create a set of bookmarks mapping to common business questions (e.g., "Why did sales drop in Q3?") to provide guided analytics structure while preserving the exploratory nature of the visual.
4. Anomaly Detection and Forecasting on Line Charts
Anomaly Detection: Configuration and Sensitivity
Anomaly detection uses the SR-CNN (Spectral Residual CNN) algorithm — the same engine as Azure Cognitive Services Anomaly Detector — running server-side. Enable it via the Analytics pane on any line chart with a date/time X-axis and numeric Y-axis. The sensitivity slider (1–100) controls flagging threshold; 70–85 is appropriate for most business time series.
Important
Anomaly detection requires a continuous time axis. A date field stored as text (e.g., month names) will make anomaly detection unavailable — always use a proper date data type with a continuous date table relationship.
Forecasting: ETS Algorithm and Configuration
Forecasting applies an ETS (Error, Trend, Seasonality) exponential smoothing model. Configure forecast length, confidence interval (80% or 95%), and seasonality. Auto-detection requires at least two full seasonal cycles of history (24 months for annual/monthly, 104 weeks for annual/weekly). Sparse time series must be padded with zero or null values using DAX CALENDAR and GENERATE before forecasting will work.
Note
Forecasting is only available when the X-axis contains a single date field with no gaps. Sparse time series must be padded with zero or null values using DAX before forecasting will work correctly.
Anomaly vs. Forecasting: Selection Guide
| Scenario | Feature | Key Configuration |
|---|---|---|
| Detect unusual spikes or drops in history | Anomaly Detection | Sensitivity 70–85; add explanation fields |
| Project future values from historical trend | Forecasting | Seasonality: Auto; 2+ seasonal cycles of history |
| Identify if a recent period is unusual vs. trend | Both overlaid | Layer anomaly + forecast on same line chart |
| Detect weekly patterns in daily data | Forecasting (manual) | Seasonality period = 7; ensure daily granularity |
5. Q&A Natural Language Setup, Synonyms, and Featured Questions
How Q&A Works: NLP Pipeline Architecture
The Q&A visual parses natural language input, maps entities to fields and measures, selects a visualization type, and constructs a DAX query — all within the Power BI platform, without requiring separate Azure Cognitive Services. The NLP mapping step is most sensitive to semantic model naming: a field named CustRevAmt nearly always fails, while "Customer Revenue" maps naturally. Q&A usage telemetry in the Power BI admin portal logs questions, field mappings, and confidence scores.
Configuring Synonyms for Accurate NLP Mapping
Synonyms are configured in the Q&A setup dialog and stored in the dataset's enhanced metadata, benefiting every report connected to that dataset. Always add business terms for technical field names, common abbreviations (YTD, SKU), and domain jargon. Use the "Review questions" feature in the Power BI service to identify real vocabulary gaps from actual consumer queries.
Tip
Review actual consumer questions that returned poor results in the Power BI service — these are the best source of synonyms to add, representing real gaps between consumer vocabulary and model naming.
Featured Questions: Guiding Consumer Discovery
Featured questions appear before typing begins, serving as discovery prompts and guardrails for reliably answerable questions. Limit the list to 8–12 items ordered simple-to-complex, covering each major business domain. After any model schema change, revisit the Q&A setup dialog to verify all featured questions still resolve — broken questions present error states that undermine consumer trust.
Warning
Featured questions valid at authoring time can become invalid after dataset schema changes. Always re-validate all featured questions after any model rename or field removal.
6. Smart Narrative Visual and Automatic Insight Generation
What Smart Narratives Do and How They Work
Smart Narratives generate dynamic text summaries using a template-based approach (not an LLM) that re-evaluates with every filter context change. In fully automatic mode, Power BI generates narrative based on visible page visuals. In customized mode, authors embed dynamic value references — DAX measures returning formatted strings — for precise business language. The hybrid pattern (automatic baseline, then customized) is the recommended enterprise approach.
Configuring Dynamic Values
Each dynamic value is a DAX measure or quick measure embedded inline via the "Add value" button in the Smart Narrative editor. Values support format strings (currency, percentage) and conditional string measures that return descriptive text based on business logic. Organize narrative-specific measures in a dedicated "Narrative Measures" table to keep them separate from analytic measures.
Note
Smart Narratives are not available for real-time streaming or push datasets. They require a standard import or DirectQuery model and do not support paginated report outputs.
Smart Narratives and Accessibility
Smart Narratives render as standard HTML text, making visual content accessible to screen readers as filter context changes — a practical compliance measure for WCAG 2.1 and Section 508 requirements. PL-300 tests which features enhance accessibility: Smart Narratives, alt text for all visuals, and tab order settings for report pages are the primary tools available to report authors.
7. Governance, Certification, and Performance for AI Visuals
AI Visual Governance in Enterprise Environments
Monitor the "AI" resource category in the Premium Capacity Metrics app to prevent AI visual workloads from crowding out other report queries. Dataset certification should include explicit AI visual validation: appropriate Key Influencers fields, populated Q&A synonyms, verified featured questions, and model naming that supports NLP. RLS applies fully to all AI visuals — influencers discovered under a restricted RLS context will differ from an administrator view, which is correct behavior.
Performance Optimization for AI-Heavy Reports
Set visual-level filters to reduce the data scope analyzed, enable the "Summarized data" option in Key Influencers for large tables, and place AI visuals on dedicated pages rather than mixing them with operational visuals. When aggregation tables are configured in the data model, AI visual queries route to the aggregated tier — reducing query time from minutes to seconds — provided all "Analyze" and "Explain by" fields are covered by the aggregation rules.
8. Lab: AI Visual Infrastructure and Q&A Automation
CE-15: Provision Premium Workspace Infrastructure
Create the Azure resource groups, storage accounts, and Log Analytics workspace supporting AI visual governance and capacity monitoring.
RG_PROD="rg-advanced-analytics-ai-visuals-prod-001"
LOCATION="eastus2"
LOG_WS="advanced-analytics-prod-eastus2-001"

az group create --name "$RG_PROD" --location "$LOCATION"

az monitor log-analytics workspace create \
  --resource-group "$RG_PROD" --workspace-name "$LOG_WS" \
  --location "$LOCATION" --sku PerGB2018 --retention-time 90

# Truncated — full script provisions storage accounts and containersCE-16: Deploy Azure Anomaly Detector and ADF Export Pipeline
Provision Azure Cognitive Services Anomaly Detector for external validation and Azure Data Factory for Power BI dataset export. Store the API key in Key Vault and configure diagnostic settings to Log Analytics.
ANOMALY_PROD="cog-anomaly-detector-prod-eastus2-001"
KV_PROD="kv-adv-analytics-prod-001"

az cognitiveservices account create \
  --name "$ANOMALY_PROD" --resource-group "$RG_PROD" \
  --kind AnomalyDetector --sku S0 --location "$LOCATION" --yes

az keyvault secret set --vault-name "$KV_PROD" \
  --name "anomaly-detector-api-key" \
  --value "$(az cognitiveservices account keys list --name $ANOMALY_PROD --resource-group $RG_PROD --query key1 -o tsv)"

# Truncated — full script creates ADF, linked service, and diagnostic settingsCE-17: Automate Q&A Synonym Validation via Power BI REST API
Use a service principal to acquire a Power BI REST API token and upload a Q&A validation configuration — required synonyms and featured questions — to storage for CI/CD pipeline use.
PBI_TOKEN=$(curl -s -X POST \
  "https://login.microsoftonline.com/${TENANT_ID}/oauth2/v2.0/token" \
  -d "grant_type=client_credentials&client_id=${PBI_CLIENT_ID}&client_secret=${PBI_CLIENT_SECRET}&scope=https://analysis.windows.net/powerbi/api/.default" \
  | python3 -c "import sys,json; print(json.load(sys.stdin)['access_token'])")

az storage blob upload --account-name "$STORAGE_PROD" \
  --container-name "ai-visual-audit-logs" \
  --name "qa-validation-config/validate-qa-synonyms.json" \
  --file "/tmp/validate-qa-synonyms.json" --overwrite

# Truncated — full script lists workspaces and verifies blob upload
9. Summary
| Concept | Key Point |
|---|---|
| Key Influencers — Categorical | Logistic regression with odds ratios; select the specific target value; avoid data leakage from derived fields |
| Key Influencers — Continuous | Linear regression; use DAX measures for KPIs; minimum segment count = max(30, 1% of population) |
| Decomposition Tree | Consumer-driven exploration; AI splits are locally greedy; use bookmarks for guided analytics starting points |
| Anomaly Detection | SR-CNN algorithm; continuous date axis required; sensitivity 70–85 for most business data |
| Forecasting | ETS exponential smoothing; 2+ full seasonal cycles for auto-detection; pad sparse time series with DAX |
| Q&A Natural Language | NLP quality depends on model naming; synonyms stored in dataset metadata and apply to all connected reports |
| Smart Narratives | Template-based dynamic text with DAX measure references; re-evaluates on filter context change; WCAG-compatible |
| AI Visual Governance | RLS applies fully to all AI visuals; monitor "AI" category in Premium Capacity Metrics; validate AI visuals during dataset certification |
Chapter: 8 of 12 | Status: v0.1 Draft |